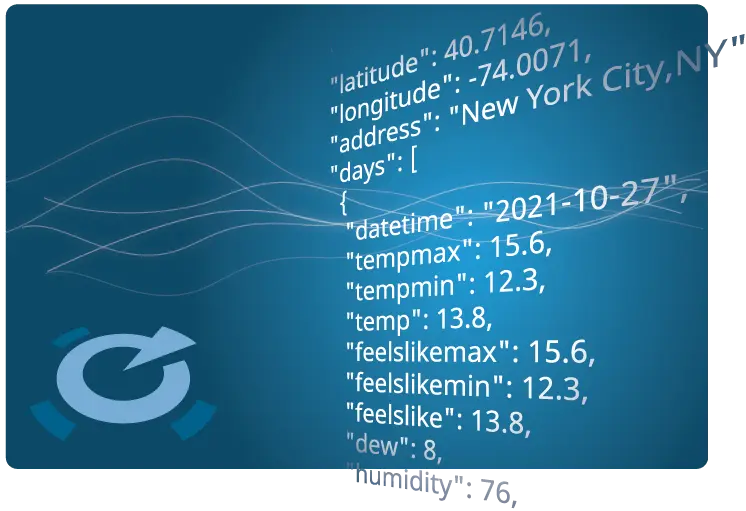
The Easiest Weather API
Query Global Weather Data API for Free
Latest news and announcements
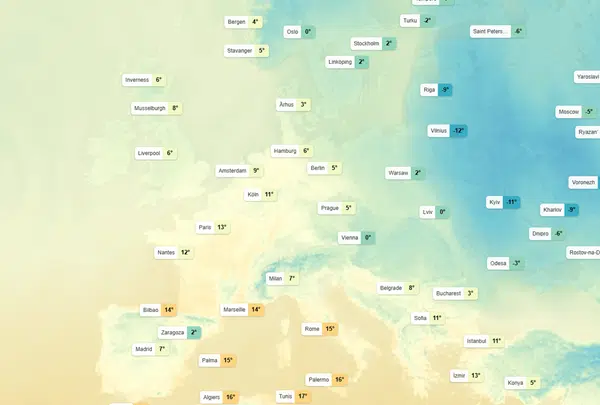
Visual Crossing Announces New Weather Maps API
Visual Crossing just launched a new Weather Maps API that makes it much easier to put high-quality weather visuals onto…Read more
Timeline LLX Introduces High-Concurrency, Ultra-Low Latency Weather API
Visual Crossing announces the release of its Timeline Low-Latency Execution (LLX) Weather API, serving ultra-fast, high-volume weather-data in real time.Read more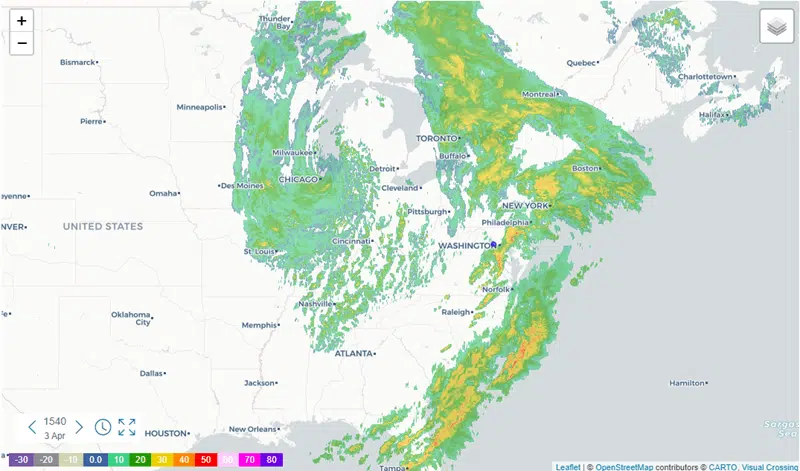
How to Include Weather Radar Data in Weather Datasets
Weather radar is a powerful tool that provides near real-time information about the state of the atmosphere. In particular, it…Read more
Use The Best Weather API For Free
Sign Up For Free
Historical Weather

Historical Forecast

Forecast & Current Conditions

Statistical Forecast
Weather Data for Every Application and Use Case
Full Weather Data Catalog
Core Elements

Solar Energy

Agriculture

Wind Energy

Maritime

Air Quality

Degree Days

Astronomy

Alerts
The only Weather API that you need for forecast & historical data
Full Weather API DataSingle API Call
A single API query returns historical weather data, current weather conditions, weather forecasts, and climate normals
Sub-hourly, Hourly and Daily Data
Our database stores billions of records containing Sub-hourly, Hourly and Daily Forecasts, and historical records for the entire globe
Ground stations, Satellites & RADAR
Our Weather Engine finds the most accurate weather reports calculated based on over 100,000 weather stations, satellites, high resolution RADAR, and more to provide the best weather API available

50+ Years of Historical Weather Data
Hourly forecasts, daily forecasts, historical data, historical forecasts, and more are available for any location in the world over the past 50 years
CSV and JSON Results
Although other weather APIs limit output formats, our Weather Engine provides both rich JSON output and universal CSV formats for easy use in any application including Excel and Google Sheets
Full location address geocoding
Access the weather data for any geo location using an address, ZIP code, city name, or latitude/longitude
Start today for free
Sign UpSign up for our free Weather API now and see why businesses, developers, and analysts choose Visual Crossing.
Fetch Historical Weather Data and Weather Forecast Data Using Sample API Queries
15-day weather forecast (US units, JSON output)
https://weather.visualcrossing.com/VisualCrossingWebServices/rest/services
          /timeline/London%2CUK?unitGroup=us&key=YOUR_API_KEY
Last seven days hourly historical Data (Metric Units, JSON output)
https://weather.visualcrossing.com/VisualCrossingWebServices/rest/services
          /timeline/London%2CUK/last7days?unitGroup=metric?&key=YOUR_API_KEY
Historical data between two dates (Metric Units, JSON output)
https://weather.visualcrossing.com/VisualCrossingWebServices/rest/services
          /timeline/London%2CUK/2022-07-15/2022-07-20?unitGroup=metric&key=YOUR_API_KEY
Daily historical data between two dates (Metric Units, CSV output)
https://weather.visualcrossing.com/VisualCrossingWebServices/rest/services
          /timeline/London%2CUK/2022-07-15/2022-07-20?unitGroup=metric&contentType=csv&include=days&key=YOUR_API_KEY
JSON Results
{
"queryCost": 1,
"latitude": 51.5064,
"longitude": -0.12721,
"resolvedAddress": "London, England, United Kingdom",
"address": "London,UK",
"timezone": "Europe/London",
"tzoffset": 1,
"description": "Similar temperatures continuing with a chance of rain Friday, Monday & Tuesday.",
"days": [
{
"datetime": "2023-05-02",
"datetimeEpoch": 1682982000,
"tempmax": 58.2,
"tempmin": 47.6,
"temp": 53,
"feelslikemax": 58.2,
"feelslikemin": 43.9,
"feelslike": 52.3,
"dew": 44.7,
"humidity": 74.1,
"precip": 0,
"precipprob": 0,
"precipcover": 0,
"preciptype": [
"rain"
],
"snow": 0,
"snowdepth": 0,
"windgust": 19.9,
"windspeed": 15,
"winddir": 86.4,
"pressure": 1026.1,
"cloudcover": 75.2,
"visibility": 6.6,
"solarradiation": 108.7,
"solarenergy": 9.2,
"uvindex": 6,
"severerisk": 10,
"sunrise": "05:31:11",
"sunriseEpoch": 1683001871,
"sunset": "20:25:02",
"sunsetEpoch": 1683055502,
"moonphase": 0.39,
"conditions": "Partially cloudy",
"description": "Partly cloudy throughout the day.",
"icon": "partly-cloudy-day",
"stations": [
"EGWU",
"EGLL",
"D5621",
"F4685",
"EGLC"
],
"source": "comb",
"hours": [
          {
          "datetime": "00:00:00",
          "datetimeEpoch": 1682982000,
          "temp": 54.9,
          "feelslike": 54.9,
          "humidity": 70.72,
          "dew": 45.6,
          "precip": 0,
          "precipprob": 0,
          "snow": 0,
          "snowdepth": 0,
          "preciptype": [
          "rain"
          ],
          "windgust": 8.3,
          "windspeed": 5.1,
          "winddir": 320,
          "pressure": 1022,
          "visibility": 6.2,
          "cloudcover": 0,
          "solarradiation": 0,
          "solarenergy": null,
          "uvindex": 0,
          "severerisk": 10,
          "conditions": "Clear",
          "icon": "clear-night",
          "stations": [
          "EGWU",
          "EGLL",
          "EGLC"
          ],
          "source": "obs"
          },...
         ]
        },...
        ],
        "alerts": [],
        "stations": {
        "EGWU": {
        "distance": 20850,
        "latitude": 51.55,
        "longitude": -0.42,
        "useCount": 0,
        "id": "EGWU",
        "name": "EGWU",
        "quality": 50,
        "contribution": 0
        },...
        },
        "currentConditions": {
        "datetime": "22:26:00",
        "datetimeEpoch": 1683062760,
        "temp": 48.5,
        "feelslike": 44.1,
        "humidity": 76.6,
        "dew": 41.5,
        "precip": 0,
        "precipprob": 0,
        "snow": 0,
        "snowdepth": 0,
        "preciptype": null,
        "windgust": null,
        "windspeed": 10.3,
        "winddir": 100,
        "pressure": 1028.7,
        "visibility": 6.2,
        "cloudcover": 36.8,
        "solarradiation": 0,
        "solarenergy": null,
        "uvindex": 0,
        "conditions": "Partially cloudy",
        "icon": "partly-cloudy-night",
        "stations": [
        "EGWU",
        "D5621",
        "EGLC"
        ],
        "source": "obs",
        "sunrise": "05:31:11",
        "sunriseEpoch": 1683001871,
        "sunset": "20:25:02",
        "sunsetEpoch": 1683055502,
        "moonphase": 0.39
        }
CSV Results
Name,datetime,temp,feelslike,dew,humidity,precip,precipprob,preciptype,snow,snowdepth,windgust,windspeed,winddir,sealevelpressure,cloudcover,visibility,solarradiation,solarenergy,uvindex,severerisk,conditions,icon,stations
"London, England, United Kingdom",2023-05-02T00:00:00,54.9,54.9,45.6,70.72,0,0,rain,0,0,8.3,5.1,320,1022,0,6.2,0,,0,10,Clear,clear-night,"EGWU,EGLL,EGLC"
"London, England, United Kingdom",2023-05-02T01:00:00,53.1,53.1,45.9,76.46,0,0,,0,0,5.6,4.9,306,1022,25.8,6.2,0,,0,10,Partially cloudy,partly-cloudy-night,"EGWU,EGLL,EGLC"
"London, England, United Kingdom",2023-05-02T02:00:00,51.7,51.7,46.7,82.93,0,0,,0,0,6,4.9,307,1022.8,24.8,6.2,0,,0,10,Partially cloudy,partly-cloudy-night,"EGWU,EGLL,EGLC"
"London, England, United Kingdom",2023-05-02T03:00:00,51,51,47.1,86.37,0,0,,0,0,4.7,5.2,10,1023,88,6.2,0,,0,10,Partially cloudy,partly-cloudy-night,"EGWU,EGLL,EGLC"
"London, England, United Kingdom",2023-05-02T04:00:00,50.7,50.7,47.4,88.49,0,0,,0,0,5.8,3.5,13,1023.8,97.8,6.2,0,,0,10,Overcast,cloudy,"EGWU,EGLL,EGLC"
"London, England, United Kingdom",2023-05-02T05:00:00,51,51,47.4,87.44,0,0,,0,0,9.2,4.1,18,1024,100,6.2,0,,0,10,Overcast,cloudy,"EGWU,EGLL,EGLC"
"London, England, United Kingdom",2023-05-02T06:00:00,51,51,46.3,83.9,0,0,,0,0,11.6,8.6,47,1024.6,100,6.2,9,0,0,10,Overcast,cloudy,"EGWU,EGLL,D5621,EGLC"
"London, England, United Kingdom",2023-05-02T07:00:00,49.9,46.7,46.3,87.38,0,0,,0,0,13.9,7.9,56,1025.6,97.5,6.2,23,0.1,0,10,Overcast,cloudy,"EGWU,EGLL,D5621,EGLC"
"London, England, United Kingdom",2023-05-02T08:00:00,51.7,51.7,46.3,81.74,0,0,,0,0,15.2,8.3,66,1025.8,97.5,6.2,60,0.2,1,10,Overcast,cloudy,"EGWU,EGLL,D5621,EGLC"
"London, England, United Kingdom",2023-05-02T09:00:00,51.7,51.7,46.6,82.75,0,0,,0,0,16.1,8.5,76,1026,97.5,6.2,97,0.3,1,10,Overcast,cloudy,"EGWU,EGLL,D5621,EGLC"
"London, England, United Kingdom",2023-05-02T10:00:00,52.1,52.1,47,82.78,0,0,,0,0,16.3,9.9,90,1026.6,97.5,6.2,97,0.3,1,10,Overcast,cloudy,"EGWU,EGLL,D5621,EGLC"
"London, England, United Kingdom",2023-05-02T11:00:00,53.2,53.2,45.2,74.29,0,0,,0,0,17.4,10.9,102,1027.6,97.5,6.2,167,0.6,2,10,Overcast,cloudy,"EGWU,EGLL,D5621,EGLC"
"London, England, United Kingdom",2023-05-02T12:00:00,54.6,54.6,45.2,70.53,0,0,,0,0,17.2,10.3,110,1027.6,90.2,6.2,448,1.6,4,10,Overcast,cloudy,"EGWU,EGLL,D5621,EGLC"
...
Weather API Pricing
Full Pricing InformationAccurate weather data doesn’t always come with a large price tag. That is why we offer pricing plans for everyone including free options to access the API. Our Metered plan is a pay-as-you-go plan that allows you the flexibility to use our weather data as you need it. For those that prefer monthly or annual subscriptions to the API we also offer a single-user Professional Plan, unlimited Corporate Plan and Enterprise Plans that are custom fit your demands for data size, concurrency or licensing terms. For more information, please see our full pricing information.
Why Choose the Visual Crossing Weather API?
Visual Crossing Weather API is the easiest-to-use and lowest-cost weather API available. Our single-call API provides unified access to historical weather data, current conditions, forecasts, and climate statistics. There is no need to learn multiple API endpoints or make multiple calls to get the data that you need. Our solution is the easiest in the industry providing both a RESTful API or integration into any code or script and our web-based Query Builder to compose queries interactively and download datasets. Whether your use case is adding weather data to application code or simply downloading weather records for analysis, Visual Crossing Weather is the best choice. And if you run into questions or problems, our support team is available to help. In addition, our prices start at free for both commercial and non-commercial use up to 1000 records per day, are only $0.0001 per record for pay-as-you-go access, and are even cheaper as part of a monthly or annual service plan.
However, don’t mistake easy and low cost for simple or cheap. Our rich data catalog provides access to nearly 100 weather elements for every location on the globe over the past fifty years and into the future. To make this accessible, our Weather Engine organizes and processes over one trillion weather records to ensure accurate, high-resolution weather answers to hundreds of millions of queries every day. Every minute, our Weather Engine loads updated conditions from around that world, and our weather database grows by gigabytes every hour to provide every query with the most accurate weather data possible.
Our passion is making the highest-quality weather data accessible to users around the world and helping people easily use that weather data to improve their applications, their decision making, and their lives. Try Visual Crossing Weather for free today and see why more businesses, developers, and analysts choose Visual Crossing.
Replace any existing Weather API
JavaScript, Mobile Apps & Web Development
Visual Crossing Weather API requests are RESTful calls that can be made easily from any client or server. The API Key allows weather forecasts and history to be incorporated into any application, website or weather app in a matter of minutes. Simply follow our tutorials and sample code, and get started with entirely free access. Our weather data API allows 1000 completely free weather records per day.

- Easy integration with JavaScript, D3 & jQuery
- HTTPS encryption for security and compliance
- Cross-Origin Resource Sharing (CORS ) for secure cross-domain requests
- Secure API Key for account protection & tracking
- Weather Data in GMT or Automatic Time Zone conversion to local time
- Designed for both client and server usage
- Enable weather in your application in minutes
Code in Java, Python, Perl & more
RESTful APIs are ideal for integration in any programming language such as Java, Google Go, VB.NET C#, Python & Perl. Access the entire Visual Crossing Weather database including weather history data, accurate forecasts, air quality data, and real time conditions to make any application more powerful.
Results are available in standard, easy-to-consume data formats including JSON and CSV. Integrating the data into your own app or code project takes only minutes.

- Full access to historical weather, 15-day weather forecast, and climate statistics
- Data formats include JSON and CSV
- Access global weather conditions from the past, present & future with a single call
- Support for multiple locations and dates in a single request
- Comprehensive documentation and samples
Weather Data for Data Science
Use industry standard tools ranging from R and MATLAB to Excel and Power Query. Tutorials and how-to articles are available for these as well as other powerful analytics and business platforms. Whatever tools power your analysis, Visual Crossing’s Weather API integrates easily providing developers the best possible weather information.

- Load past, present, and future weather data with a single call
- Use powerful tools such as R to calculate statistics & do analysis
- Use enterprise tools such as Power Query & SAP to share with your team
- Use our Bulk Request Functionality to load large datasets
- Analyze weather data combined with other business data
- Videos and tutorials show the step-by-step process for many standard tools
Microsoft Power BI
Power BI is an interactive business intelligence tool designed to be simple enough for end users to create their own analyses while being powerful enough for enterprise-wide use. Weather data fits naturally into this analysis framework, and the Visual Crossing Weather makes the integration easy. Our query URLs can return CSV results that import directly into any Power BI report or dashboard.

- Find valuable correlations between business data and weather
- Load weather data directly from our cloud-based servers
- Save and share weather reports and dashboard across any team
- Ready-to-use samples get your project up and running quickly
Business Intelligence Platforms
High-end BI platforms represent the backbone of data analysis within many large and mid-sized companies. These powerful tools can crunch decades of business and external data to find patterns and make recommendations. By seamlessly integrating into BI environments, Visual Crossing Weather can be embedded directly into many business applications.

- Find valuable insights comparing business data to weather
- Sample ETL scripts, plug-ins, and example dashboards available for many platforms
- Import weather data into your corporate data warehouse
- Get added insight from your existing BI investment
Google Sheets
Google Sheets has become a universally accessible data analysis application due to the global reach of its web-based platform. That web platform powers instant data sharing in schools, companies, and around the world. Visual Crossing Weather data can be integrated easily into any Google Sheet application using a single API call.

- Directly load historical and forecast weather data into any Sheet
- Update live weather results directly in Google Sheets
- Share weather data analysis instantly around your team or around the world
- Free for commercial and non commercial use
- Ideal for academic and education users
Databases
An enterprise data warehouse is the heart of data science, machine learning, and business analytics for nearly every large and mid-sized corporation. The power to store vast amounts of business data enables analysts across an organization to work together to make intelligent business decisions. Visual Crossing Weather allows historical weather data, forecasts, and historical forecast data to be loaded into any database or data lake.
Many business activities are affected by weather. Adding weather data to an enterprise data warehouse brings new insight and more ROI from your existing investment.

- Easily load weather data using ETL and embedded queries
- Compatible with any database, cloud storage, or data lake
- Dynamic queries load fresh weather data automatically
- Power analysts and planners across your entire the enterprise
- Find new insight from your existing investment
Full Weather API Documentation, sample code and demonstrations
Full Weather API DocsGetting started
Weather API Documentation
Replacing existing Weather APIs
How to replace the Dark Sky API
How to replace the Google Weather API with Visual Crossing Weather
How to replace the Yahoo Weather API with Visual Crossing Weather
How to replace the Weather Underground API with Visual Crossing Weather
How to replace the OpenWeather API with Visual Crossing Weather
Microsoft Excel
Weather Data Features
How to create annual or monthly climate summaries and normals for a location
How to use historical weather data to forecast the weather for any day of the year
How Historical Weather Data Records are Created from Local Weather Station Observations
Available Data for Visual Crossing Weather
How do we create our weather forecast?
How We Process the NOAA Integrated Surface Database Historical Weather Data
Database and scripts
How to load historical weather data using Python without scraping!
How do I retrieve weather data using an ODATA request?
How can I find weather forecast data for analysis in R?
How can I find historical weather data for analysis in R?
How to fetch weather forecast data from a RESTful web service in Java


