

In this article, we will show you how to easily download historical weather data as a standard CSV file that can be imported into thousands of data analysis and storage applications such as business intelligence systems, visualization tools, statistical analysis packages, and databases.
If you would like to download weather forecast data as a CSV, see the companion article.
What you can download
Query Builder is a powerful designed to allow all users to build anything from simple to complex, small to bulk datasets. In addition to this it can create the API Query URL to automate the exact queries that you construct here. Here is a simple list of what is possible in Query Builder:
- historical daily weather data
- historical hourly weather data
- custom selected weather elements from our entire library of elements
- CSV, Excel and JSON formats
- data for a single location or multiple locations
- setting up schedules to update this query as desired
- full datasets delivered direct in your browser or retrieved through web links or dynamic API calls
Here are the simple steps we will follow:
- Sign in to Visual Crossing or Create a new account if needed
- Open Query Builder
- Enter a location for the weather you require
- Choose a historical date period
- Choose daily or hourly data
- Download data as CSV
- Consider automating CSV data queries and retrievals
Step 1 – Sign-up/Sign-in
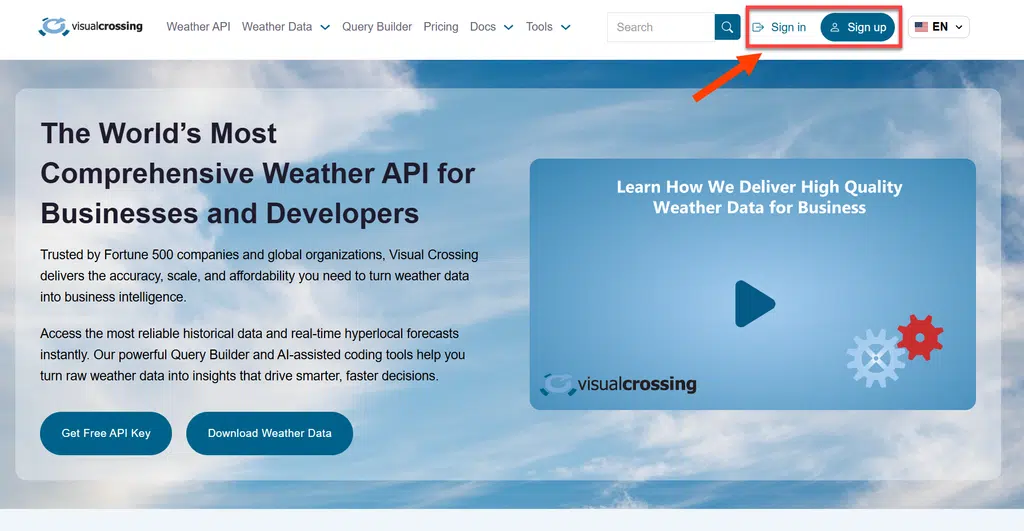
Start by visiting the Visual Crossing signup page and create an account or simply sign in to your existing account if you have already created an account. Visual Crossing offers many different levels of subscriptions including a Free option. Visit the visualcrossing.com web page to get started and follow the appropriate links to get into your account.
Step 2 – Open the Query Builder
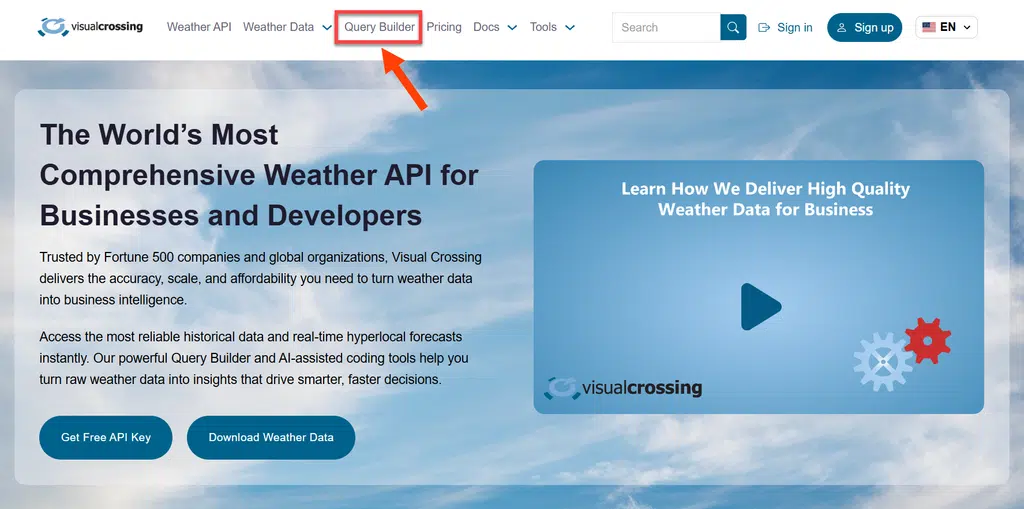
The Visual Crossing Query Builder is designed for both simple users as well as advanced API users to either download data or build a URL query string that can be used to access our RESTful API weather service and retrieve data dynamically through virtually any scripting language, ETL, Excel, PowerBI or other data tools. In this exercise we will focus on retrieving a CSV (comma separated values) dataset for you to directly download to your device as a standalone file. Let’s start by choosing the ‘Query Builder’ link from the home page we started with above. Here is a shortcut: Visual Crossing Weather Data Query Builder
When you visit the query builder page for the first time, the system will request that you provide a starting location for your query.
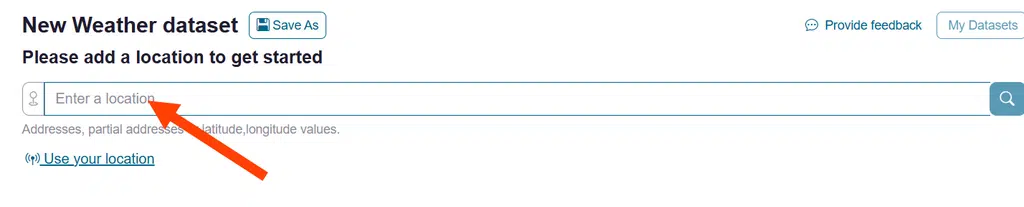
To get started you can provide the Query Builder with the location you wish to find weather for. This can be as simple as a Zip Code (60633), A latitude/longitude pair in DD format and comma separated, city name with either state or country (Chicago, IL) for completeness or a full street address of any global location. This value that you enter will be converted to a specific point on the globe so that the system can find the weather data for that exact location.
NOTE: Visual Crossing does not snap your location to the nearest weather station but rather it uses multiple nearby stations to interpolate more exact weather for your detailed, custom location. The more accurate your location you give, the more accurate your weather will be.
Once entered, hit the search icon to move to the next step.
Step 3 – Building the Weather Query
After entering our first location we can now see our Query Builder and it has already started a query for you. Here is a quick anatomy of the page for your reference:
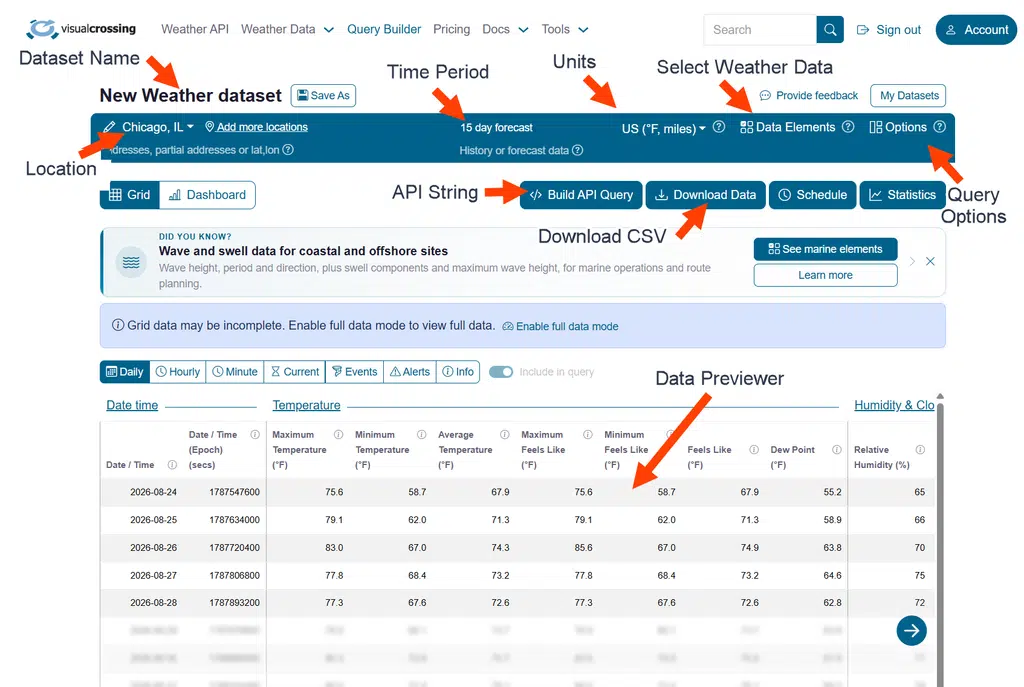
We will not cover the entire feature usage of the Query Builder in this tutorial but we will refer to these different sections. The simple steps we will take are: 1) provide location (done!), 2) provide historical time window & finally 3) download the data which has a few options for us.
Step 4 – Choose a Historical Time Period
The first thing to understand is that Visual Crossing’s Query Builder uses the Timeline API. This powerful API allows us to choose any dates we wish even if they go from the past into the future. In this exercise we will only include dates in the past as we are looking to get our data in CSV format. When you first open Query Builder, the Time Period section may show a forecast period such as ‘Next 15 days.’ For historical weather data, select Date range and then choose the start and end dates you want.
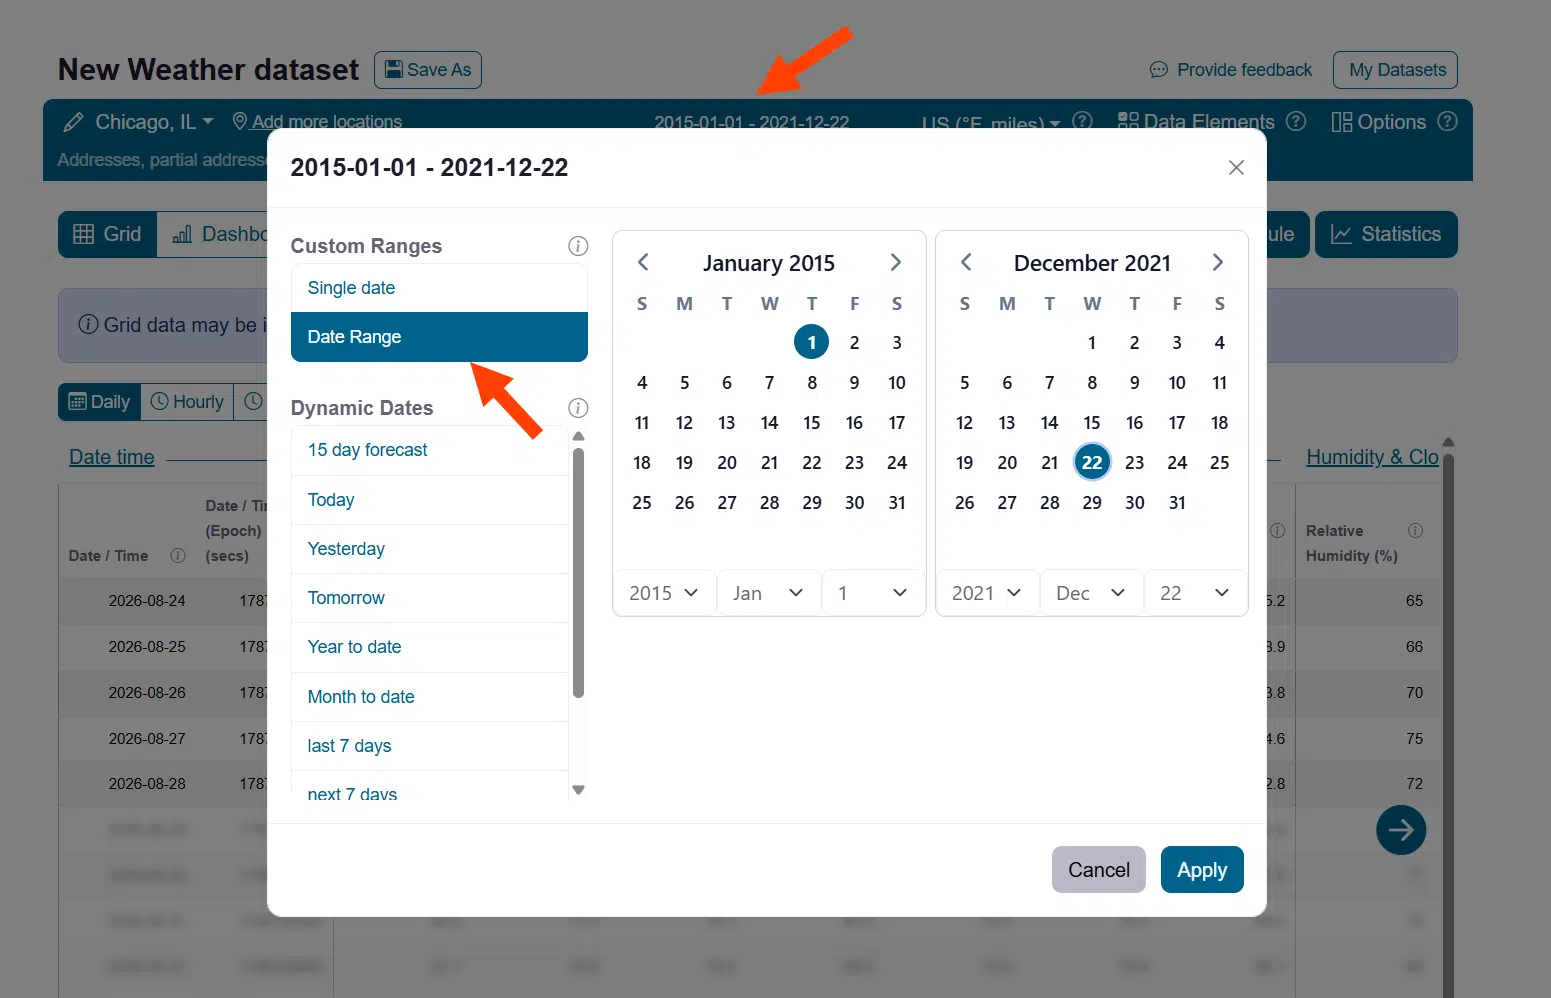
By choosing “Date Range” we are telling the Query Builder that we want to select our own dates for this query. We do this next by choosing our start and end dates:
In our example here we are choosing dates from January 1st, 2015 -> December 22nd, 2021. While using the Date Chooser you can use the arrows to change months or click on the Month-Year title to change by years and months.
We now have finished the Location and Time Period for our query.
Step 5 – Preview Results & Download
Every time we make a change to the query sections, the Results Preview Window automatically updates with a sample of our data. By default, our view is “Grid” and our Data Result Section is set to “daily” to show us daily results for our time period on a formatted grid. Later you can explore the “Dashboard” view to create custom dashboards for your results. Let’s start the download process:
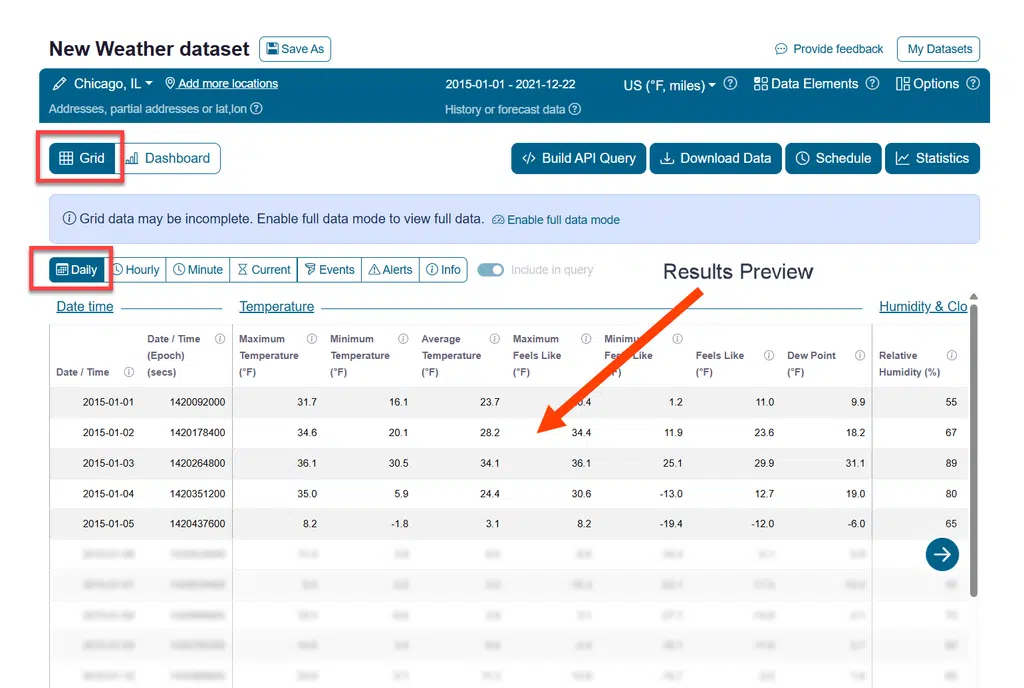
Please note that the Results Preview Window is just a view of many possible data sets that this query can bring back. The actual query brings back more data for different sections including daily weather data, hourly, station info, query information, and can bring back Current Weather, Events and Alerts. If you are retrieving results in JSON you can get all of these in the same result. However, for a simple table format such as CSV we have to choose the one we want and we will do that during the Download process. This tutorial focuses on the most common Weather Data section as either daily or hourly granularity.
The Viewer Mode buttons can show you more than just the Grid we see above, it can show the JSON results in raw form, Charts of summary data and even a copy/paste URL API query string that you can paste into a browser, Excel’s “From Web” data function or a script for dynamic queries.
Back to our task at hand…. Let’s download.
Start by clicking on the “Download” button at the right side of the Query Builder.
Step 6 – Download Options
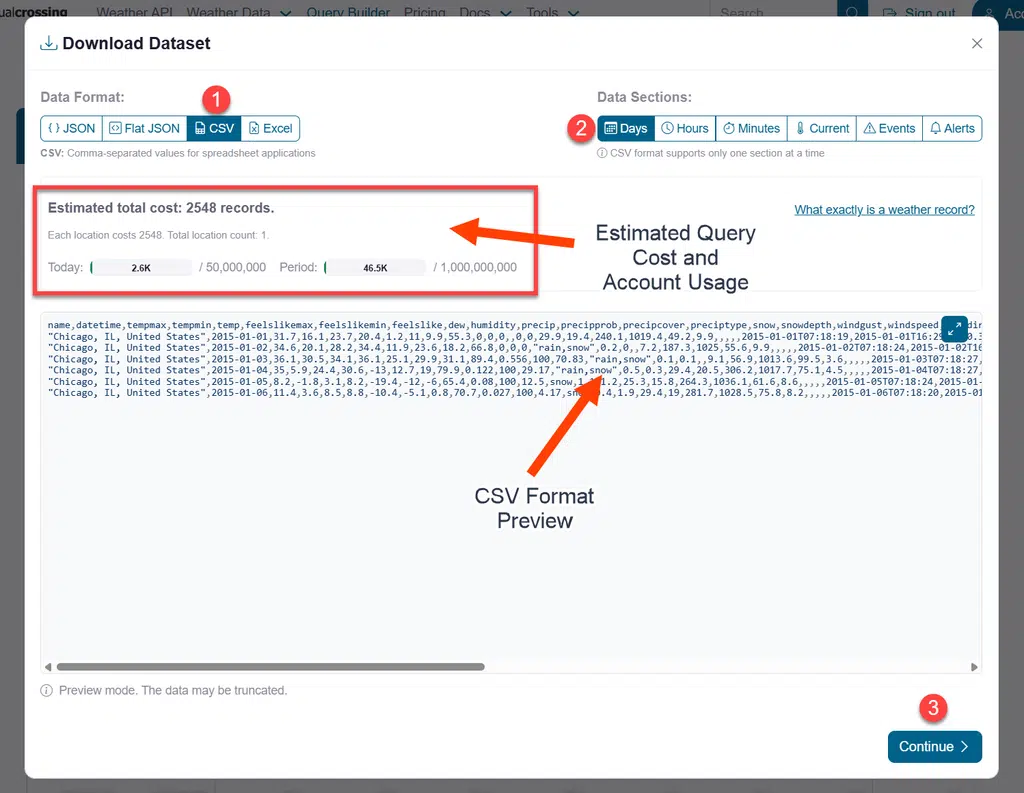
As we can see in the image below, after clicking the “Download Data” button, Query Builder asks us for the format type (we choose ‘CSV’) and we choose the ‘Daily’ dataset that we want to output at CSV. (we can easily choose to get hourly data here instead for 24x greater results by hour of day)
NOTE: If you are a JSON user you can get all of these sets in a single result set, but remember that JSON is not easily read in a table format or importable into Excel. This is for users that are set up to parse JSON results through a script or application.
On our next page we can name our dataset. Note that the default name is your Location and your Time Period.
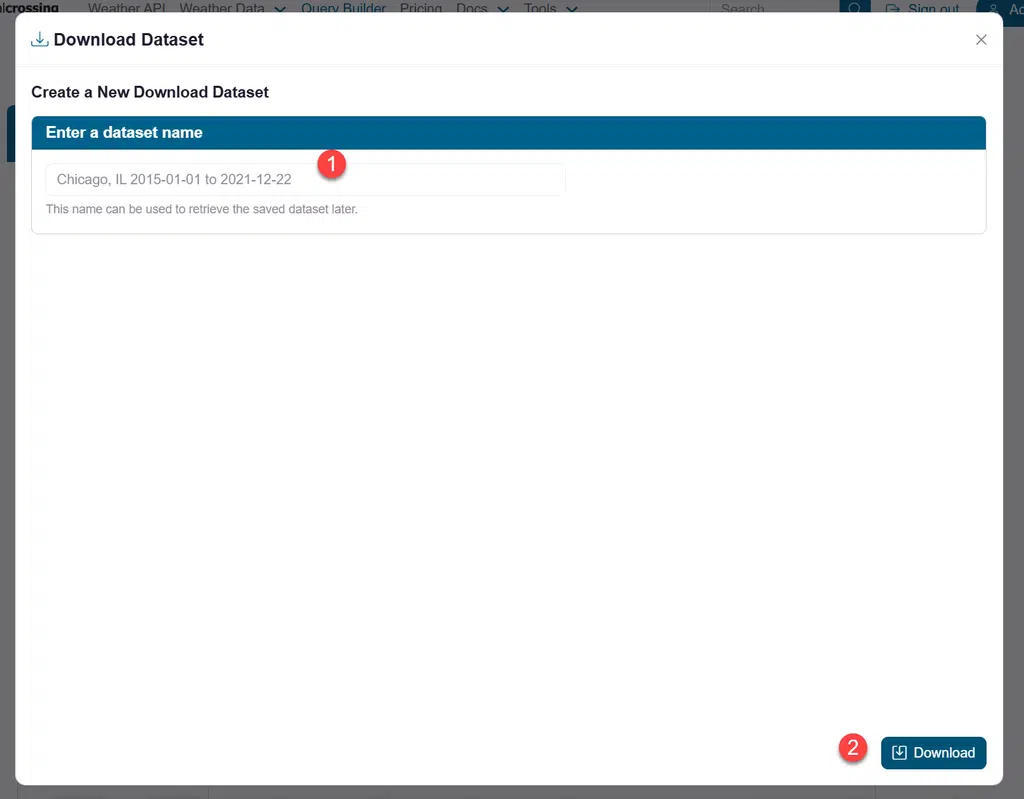
Now we can click our “Download” button and you will have your CSV weather results automatically downloaded via your browser as a file.
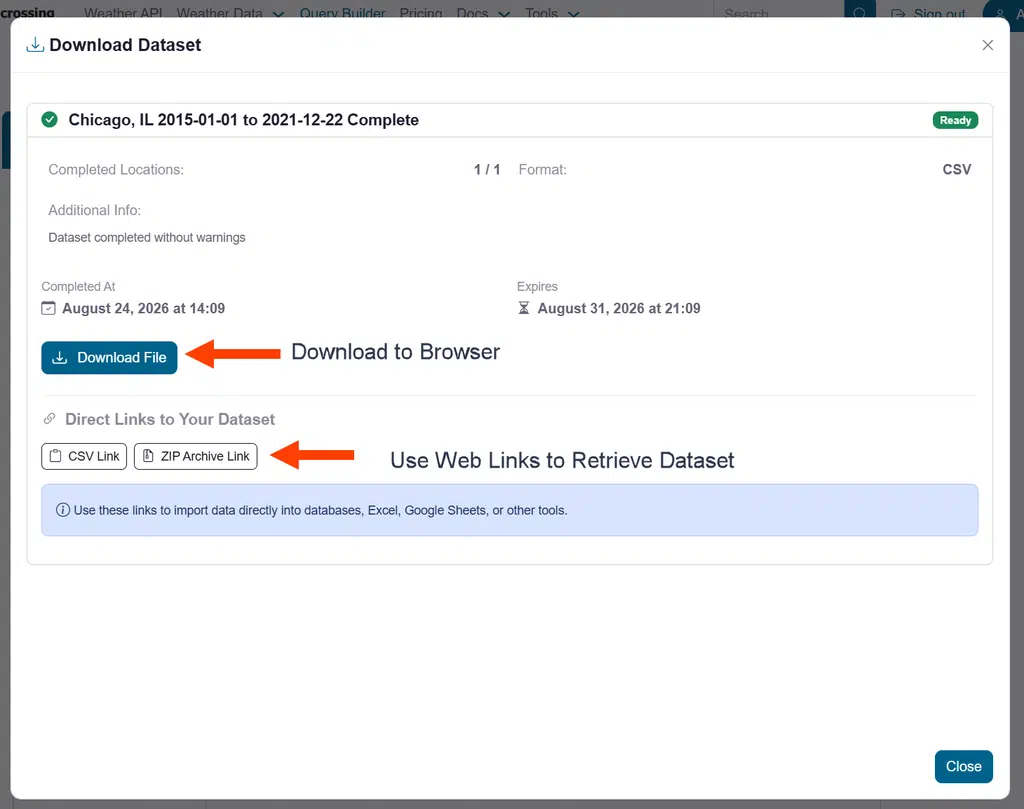
If the automatic download to your system occurred via the browser, you will see it in the file download section of your browser. For more secure systems they will require that you click the blue, manual download button to complete the download to your device.
NOTE: If later you want to download this exact file again you can visit the “My Datasets” link from the main Query Builder page.
You can now open your CSV file in notepad, Excel or any other system that supports this format and begin your weather analysis!
Additional Thoughts
There many, many settings for you to explore in Query Builder and here a few common requests that our users have:
Schedule: Certain license levels can choose to schedule a daily refresh of this dataset. As with all datasets the scheduled runs will appear in “My Datasets” section for later retrieval. Scheduled datasets also have a permalink to the latest version of the dataset in your archive.
Cost: Query Builder displays the metered cost for your query before you download it. Costs and usage limits depend on your current plan and query, so see the current pricing information for details. See the pricing page for more details: https://www.visualcrossing.com/weather-data-pricing
NOTE: Please use caution with your changes and re-downloads in Query Builder. You are charged for every download of a unique dataset. Any slight changes and re-download are billed in full. Only file datasets found in “My Datasets” are free to re-download.
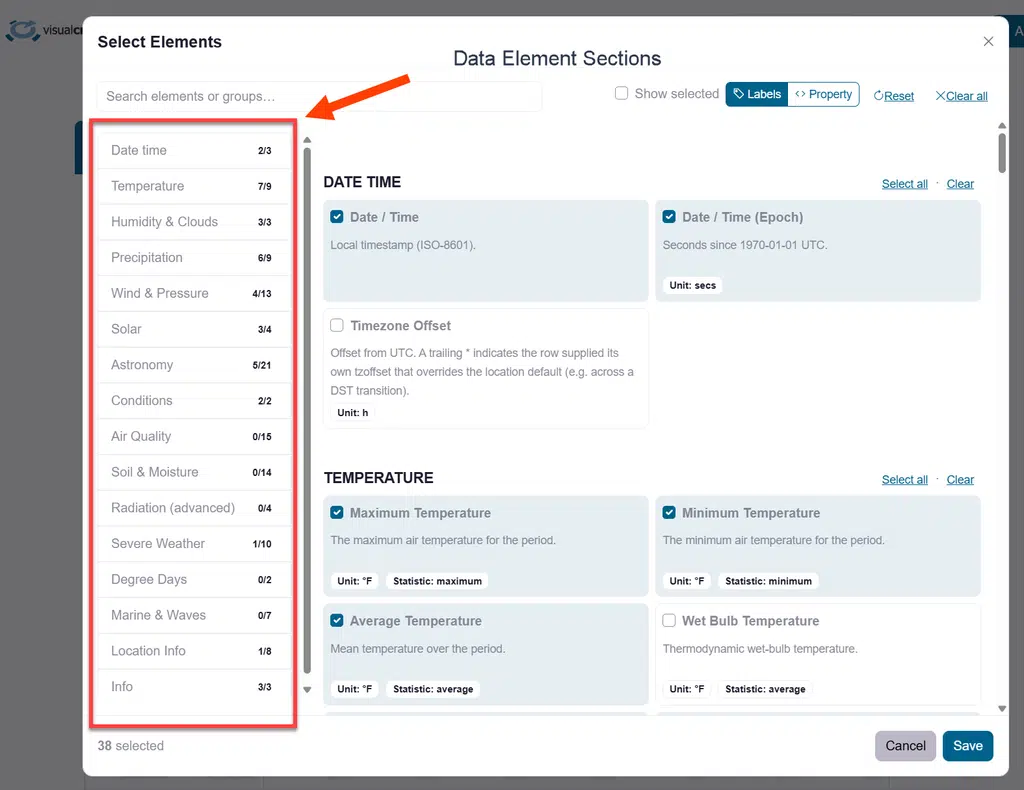
Element Choice: If you select “Data Elements” you can choose a specific set of weather elements to bring back in your dataset:
Additional Data
If you would like to learn more about using Visual Crossing Weather options such as weather forecasts, multiple location import, and use within other analysis tools please see our other tutorials.