

Weather Data Services provides an easy way to access weather forecast data, historical weather observation data and historical summary data. The data is accessible in three ways – directly in the browser, as a data download or as a Restful API link. We will show you how to build the query in your browser and how you can access this data in the various ways.
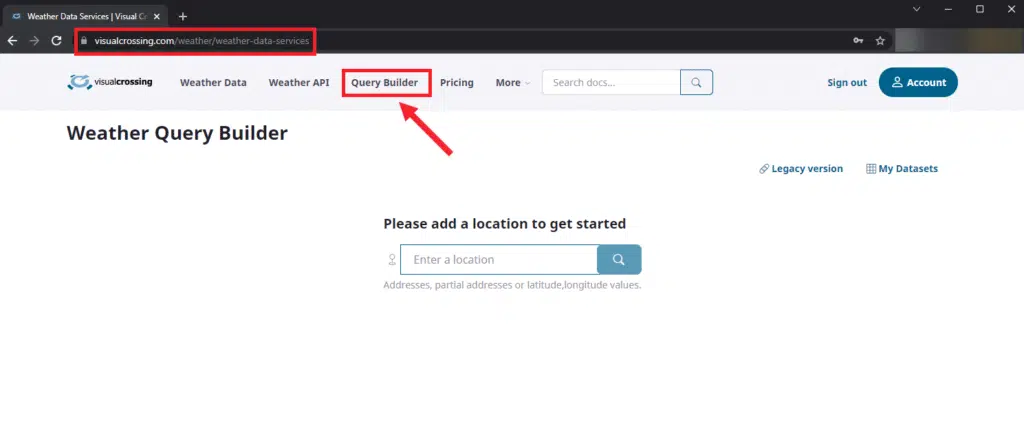
This article steps you through the process of obtaining weather data though the Weather Data Services page also known as the Query Builder. (seen below)
Need help?
For more information we have full support available to you.
Also you have access to open tech support tickets if you have additional questions.
Creating an account
The initial page of the application prompts you to either log in or create an account.
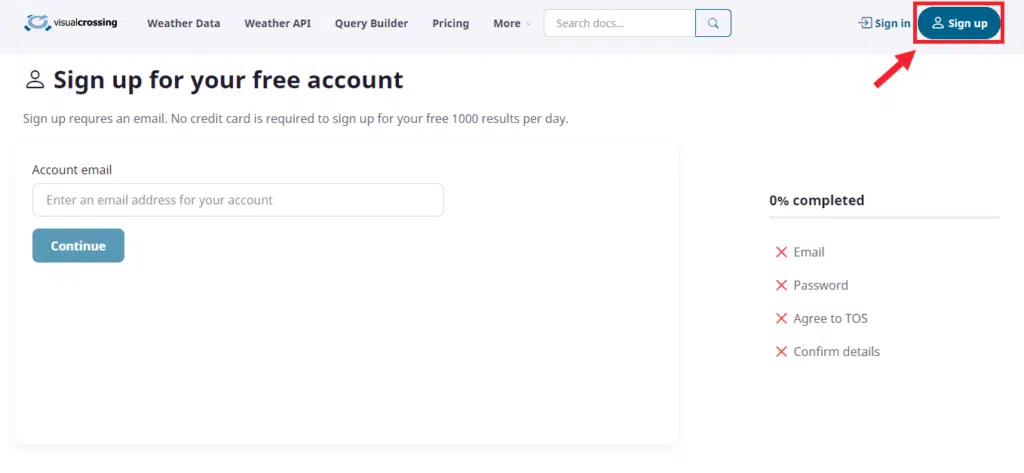
As we have never created an account before, press ‘Sign up’ to create a new account and start a free seven day trial.
The Sign Up process will walk you through the steps to enter an email, validate the email and finally create a password.
For more information on creating an account, see How to sign up for a Weather Data & Weather API Account
Retrieving our first weather data
Once you have created an account, return to the opening log in page and sign in with your new credentials.
The first screen you will encounter will ask you to provide the initial location you wish to query on. You can add more later, but to get an initial, default query for you the system needs a valid location.
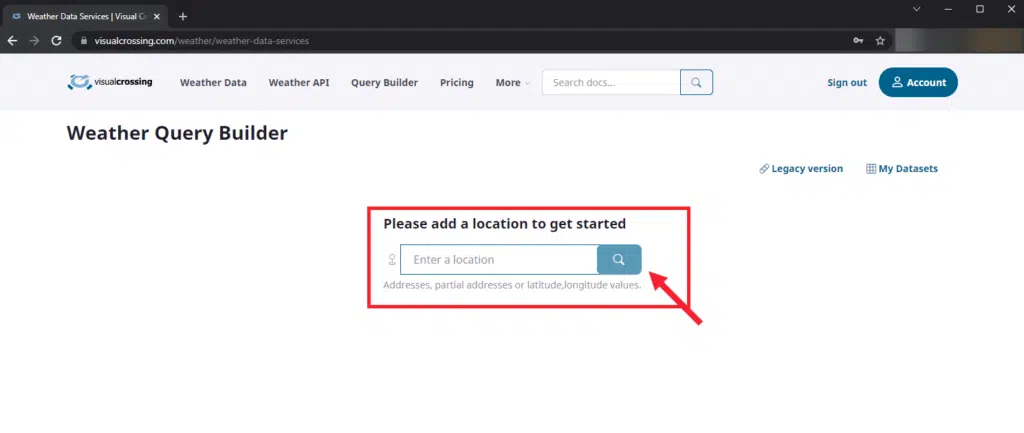
Simply enter a valid location via one of the following forms:
- City, State or City, Country
- Full Address
- Postal Code
- Latitude Longitude in DD format
- Weather station in the form of “stn:<mystationID>” replacing brackets and mystationID with an official station ID.
We will start by entering “Chicago, IL” and clicking on the search icon. Here we can see that the Query Builder has already created a basic query for us complete with a preview of results.
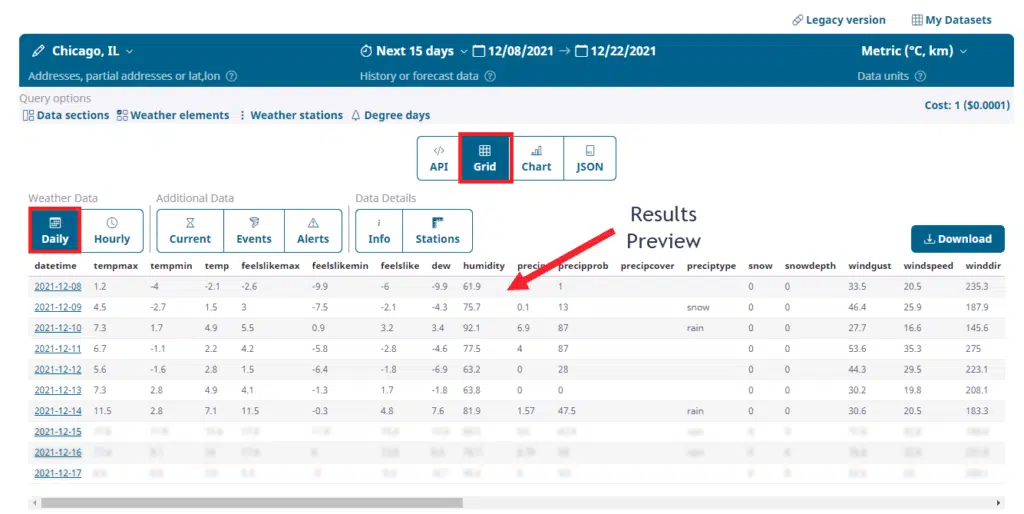
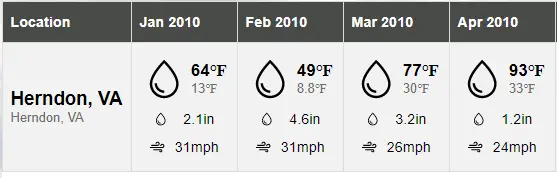
The first initial result is for Chicago, IL and it runs our “Next 15 Days” forecast at the daily result level and shows it to us a grid. If we are looking for this forecast in this format, we are done and can go right to downloading the data.
However, in this tutorial we will show you a full set of features that you can utilize with the Query Builder, lets first look at the anatomy of the main Query Builder page:
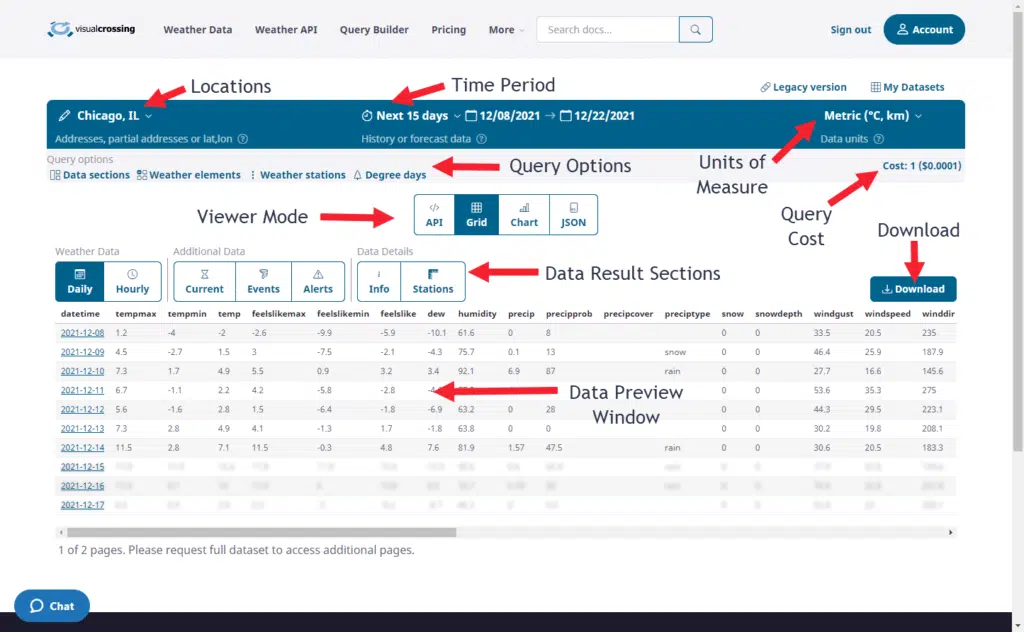
Let’s briefly cover the main sections highlighted in our screen capture above:
Locations – In this section we can change our location or add multiple locations to our query. We can choose as many locations as is reasonable in the web interface.
Time Period – this section allows us to choose the time period for which we want to retrieve weather data for. Query Builder is built upon the Visual Crossing Timeline Weather API and as such, we only need to select a preset time window or provide start and end dates. We don’t need to tell the system that we want Forecast or History as your dates can be in both data sets. Here is the default list of options:
- Next 15 Days – This is the standard 15-day forecast from today.
- Date Range – Any pair of start and end dates will retrieve the weather for that location between those dates.
- Dynamic Date Macros – Included are several dynamic date range macros that make it easier for scripts and spreadsheet updates to make a single query and not have to recalculate a dynamic date range in code:
- today, yesterday, tomorrow, yeartodate, monthtodate, last 7 days, last 30 days, last 24 hours, next7days,next 30days, next24hours
Units of Measure – In this section we can change our preferred units of measure for our specific country or our purpose such as scientific use.
Query Cost – To make pricing more transparent, our Query Cost Calculator is built into the Query Builder interface. It bases the cost on our standard Metered billing cost which is $.0001 per row of historical data or $.0001 per 15-day forecast per location. User that have monthly or enterprise subscriptions will not be billed for this usage but simply the results they use will count toward their monthly limit.
Query Options – There are several types of query options and some have a great multitude of sub-options. We will briefly cover a few of them here:
- Data Sections – There are two main areas for options under Data Sections: Content Type and Content Sections:
- Content Types: Users can choose the data output as JSON, CSV (Comma Separated Values) and Excel. JSON is used almost exclusively by coders and can include ALL data sections at once due to its complex object notation. CSV and Excel outputs are tabular forms of data that are useful for downloads and for loading into databases or spreadsheets.
- Content Sections – Data queries can contain the following sections. JSON can contain all but tabular outputs can only contain one.
- Daily – hourly weather results aggregated to day level averages, maximums and minimums
- Hourly – hourly weather data results, typically distance interpolated from multiple nearby weather stations for accuracy.
- Alerts – specific area government-issued alerts that your location will fall into. These are not pro-active alerts but rather queried for by the user.
- Current – current weather conditions for your location
- Events – historical weather events as logged by the weather provider for your location. This will typically indicate severe weather events and hazards for the location you queried. This can include events from tornados to fallen tree hazards due to storms.
- Weather Elements – This section allows users to select exactly the columns of weather they they wish to retrieve, including if they want station data included with the weather metrics.
- Degree Days – Degree days are used in agriculture, heating and cooling applications to measure how the temperature affects the operation of a farm or system. Degree days are not available in all plans.
- Weather Stations – This allows the users to limit the stations that are used for each location. They can choose how many locations are chosen and used in the interpolation of the weather data. It also can limit how far away stations can be for inclusion. No selections here will choose 3 locations by default and 50 kilometers or miles. Please note that these stations values apply to *hourly* results. Every hour, 3 different stations may appear for the same location if certain stations are not reporting accurately or completely.
- Advanced
- Data Sources – These advanced options should only be used while consulting support to retrieve advanced data. Most importantly in the list is Forecast as History which will choose to insert forecast data into a recent history data when the history data has not yet been recorded by the station. This is helpful for less-maintained stations but when the user still needs a complete dataset. Forecast data from the day of is highly accurate and a suitable substitute for non-recorded data.
- Output Options – This allows users to substitute for null data values
Viewer Mode – When viewing data results, the user can choose to see the results as Grid, Graph, JSON or API Query which is a string that produces the dataset results.
Data Result Sections – As described above, there are different sections to a data result set. In this area, the user can choose to preview any of the sections that can be set for output. While JSON users will get all sections that they request in a single set, CSV and Excel result sets can contain only one section can be downloaded in a single file of data. The most typical use is to download hourly weather data or daily weather data set as a single file.
Download Button – The download button requests that a file be created for the chosen result data and be downloaded via the browser. Typically after clicking download, the user will be asked to confirm some selections about the file(s) to be downloaded and submit the final, billable query. A final download button will be offered to retrieve the data file through the browser.
Example History Query
Let’s change our initial forecast query for Chicago, IL with the following additions:
- add another location
- create a history query for hourly data
- our dates are January 1st, 2015 – January 31st, 2015
- limit the dataset to Temperature, Humidity, Precipitation and Wind values
- retrieve the data in a tabular CSV format, but we may want the file or to pull the data directly into Excel or use the file to load into a database.
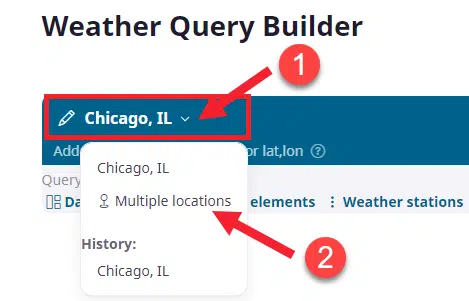
Let’s begin by adding a second location. Simply click on the pulldown arrow next to our current location and choose ‘multiple locations’.
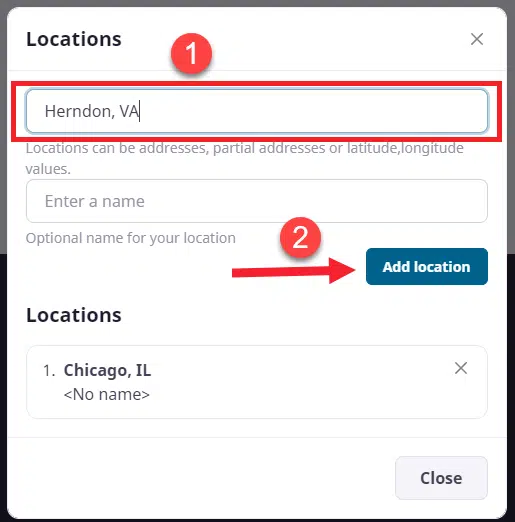
Then add another location such as “Herndon, VA”:
Now we can move onto steps 2 & 3 and change our timeframe for the query. We do this by selecting the pulldown arrow next to the ‘Next 15 days’ option:
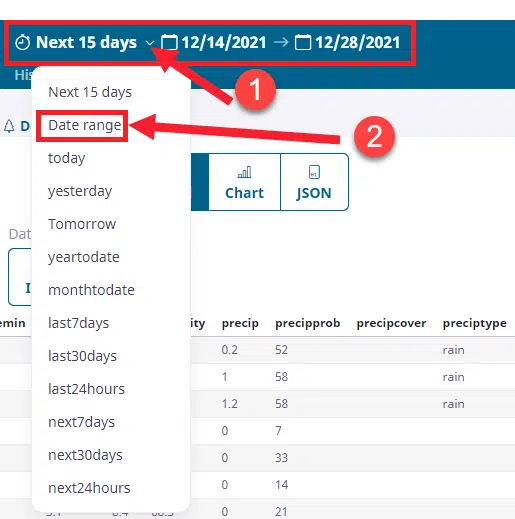
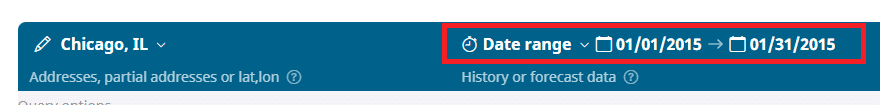
We can now choose “Date range” and set our dates to 1/1/2015->1/31/2015:
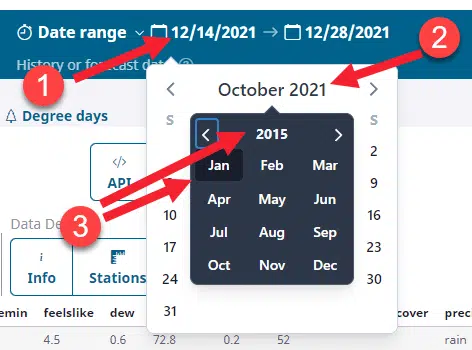
Make sure to click on the current Month/Year to change the years faster than scrolling through months.
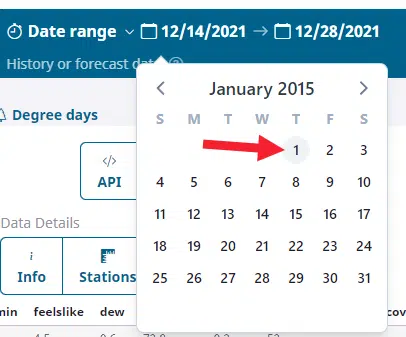
Repeat for our end date and we are done with this step:
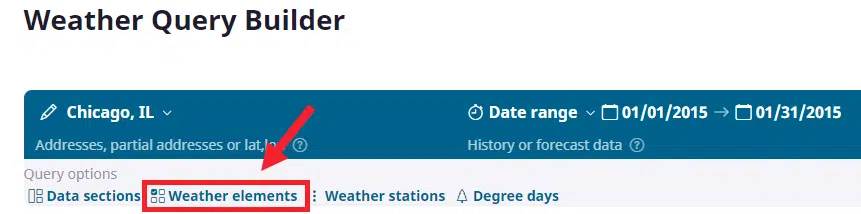
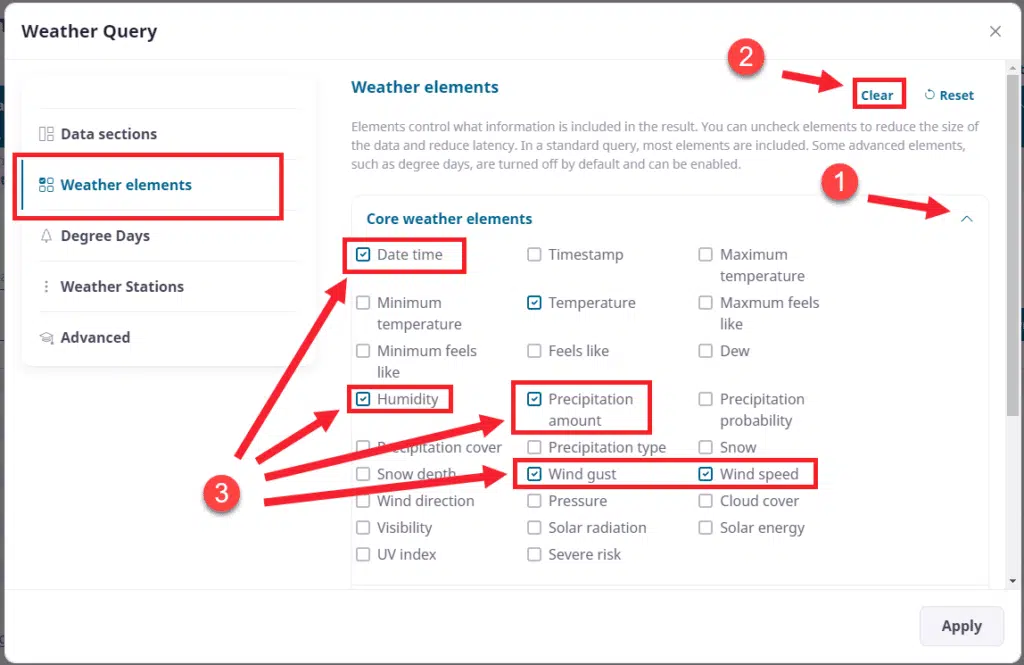
For step 4 we will click on “Weather Elements” to limit our weather metric result columns:
Now we can choose open “Core weather elements” and make our selections:
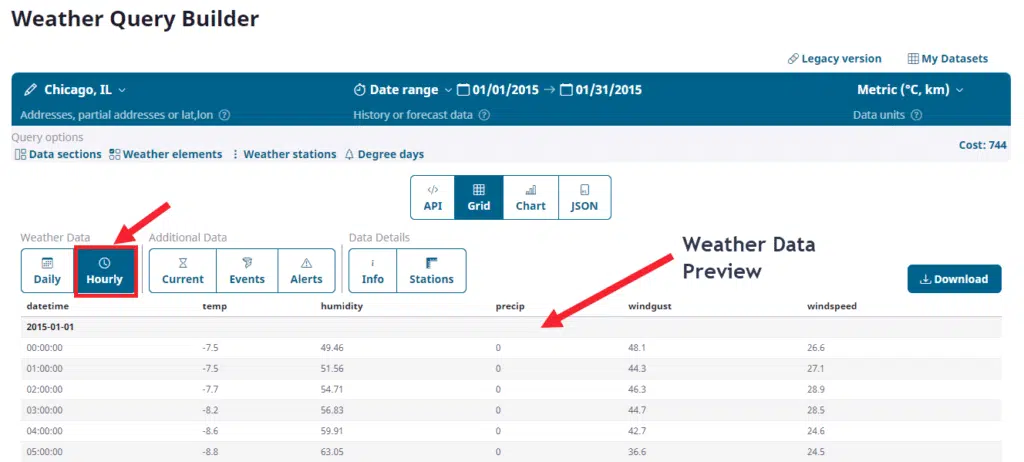
We can now see the preview of our new weather dataset and we can choose to view it by hourly data to make sure it represents the data we wish to download:
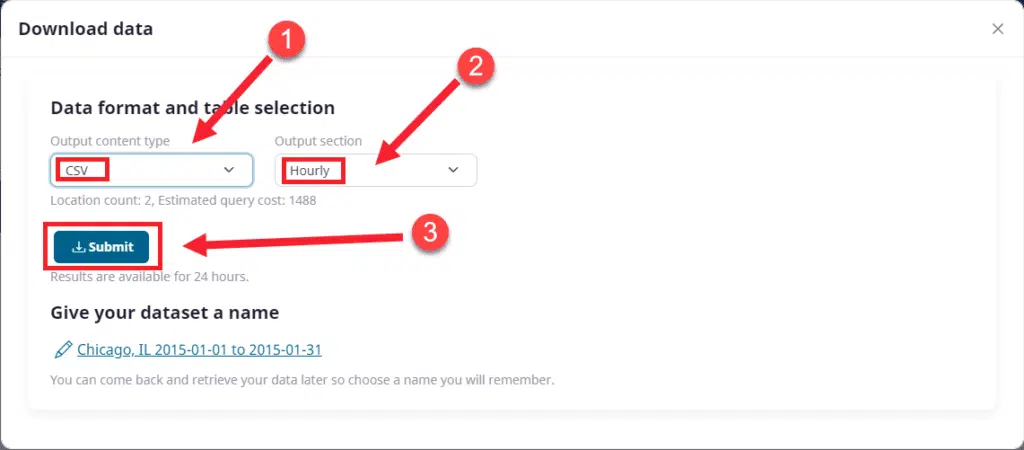
We can now simply click on the “Download” button to retrieve our data. Make sure to choose the ‘CSV’ option and ‘Hourly’ as our result dataset.
After selecting submit the billable query will be run and you will be offered to download the actual data file from your browser to your file system:
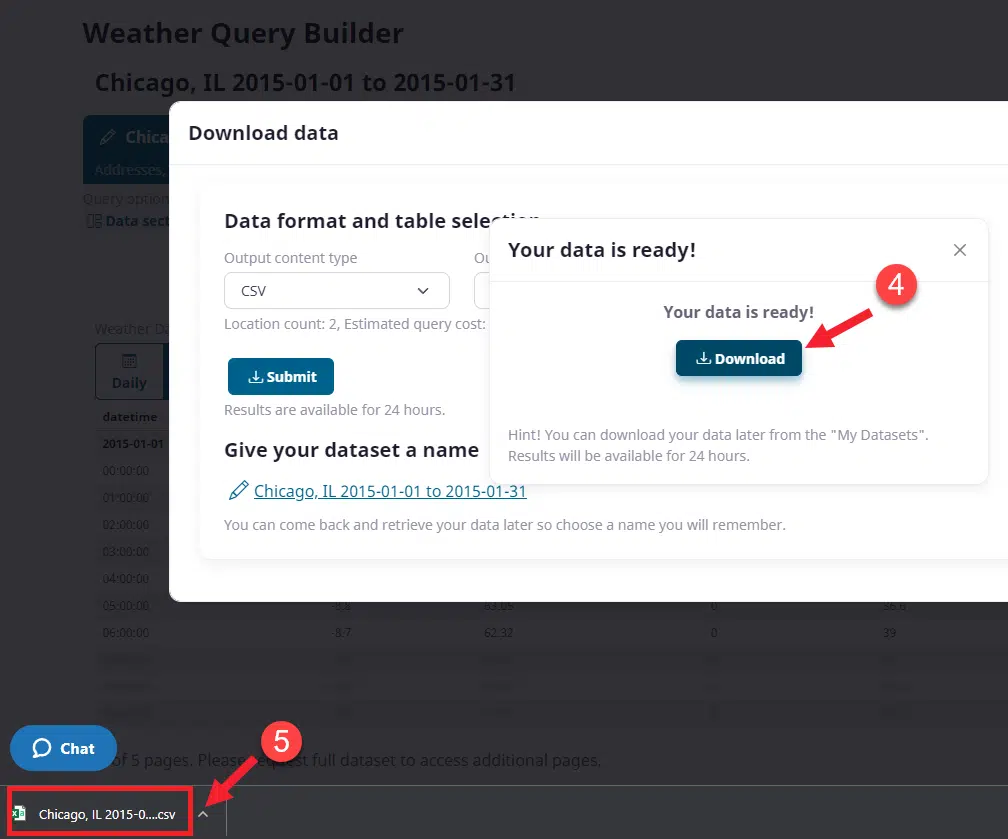
After clicking the final download, you will see your file appear in the browser download window. If you do not get the file, please check your security settings on your browser. This file can now be opened in Excel or any other application that can read and/or process tabular data in the CSV text format.
Other Data Download Options
As mentioned in the opening paragraph, there are 3 main ways to retrieve your data. We will do this for our sample weather history query for demonstration purposes. The name of this tool is Query Builder because it not only allows you to retrieve a file of data as we did above, but also that you can build a query that you can refresh, parameterize and call from applications, ETL scripts and data tools such as Excel to load data directly.
To do this we will choose the “API” button from view toolbar. Here you can see a URL string that contains the query we defined as well as our API Key for our Account. (also accessible from the “Account” section of the web page at the upper right.
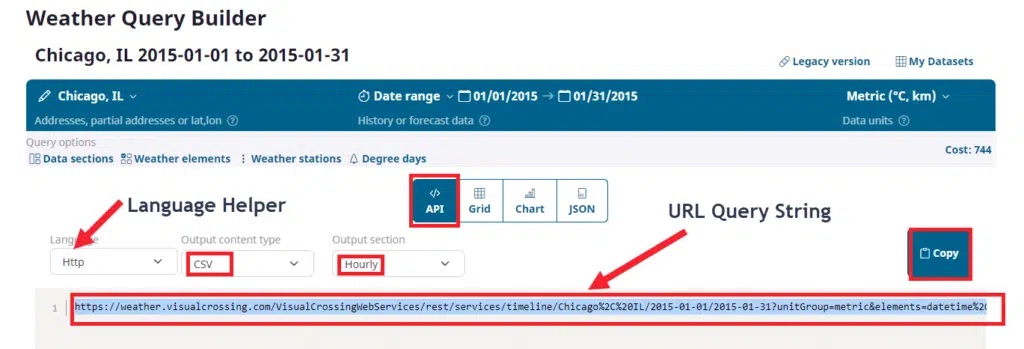
To match our file download we can choose CSV and Hourly options. You can see a preview of your URL Query String and use the “Copy” button to put the string in your buffer for use in your scripts or other applications.
Please note that the default is an https query string but variations for other scripting languages are available in the pop down menu.
NOTE: Please make note that the the API only queries one location at a time. It is up to you or your script to cycle through all of the locations and query for each one separately. The Query string here is just a starting point to help you build your query. You can parameterize all aspects of this string to make the query as dynamic as you need.
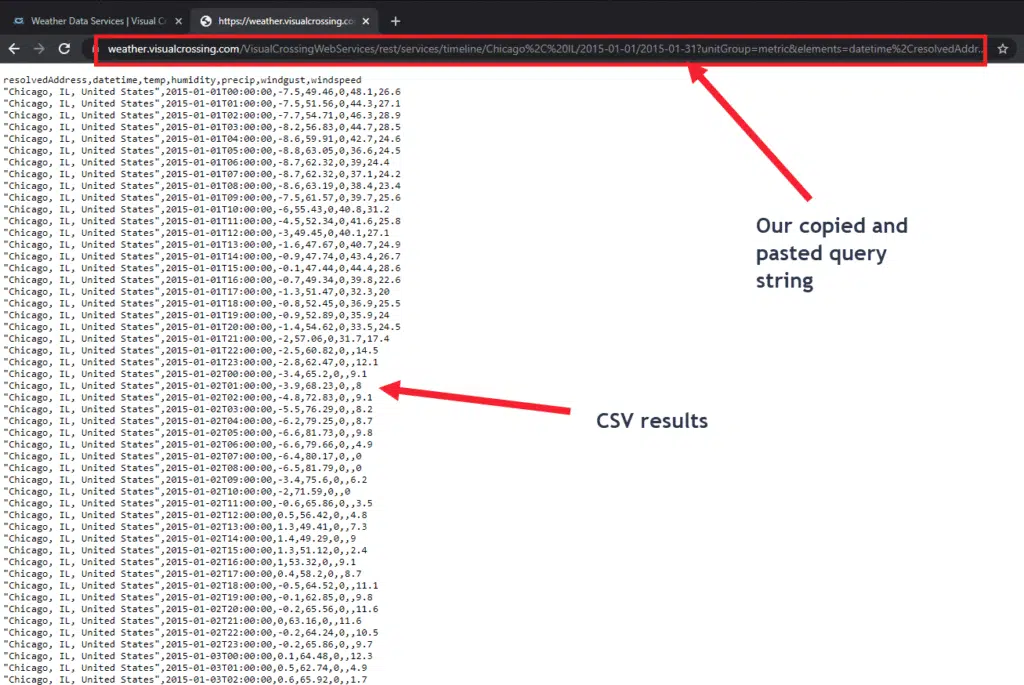
If you want to see the browser results of this query string you can test it by simply pasting it into the address bar of any browser:
One final usage of this query string is to load it directly into Excel using the “From Web…” function which uses the built-in Power Query function. You can read more about it here:
For more information on how the data is gathered and interpolated please read the following blog document.
Historical Summaries
The final query type is Historical Summaries. The goal of the summary query is to give the user some level of reporting control without requiring downloads of large historical datasets and import actions into a tool like Excel or Business Intelligence systems. The Historical Summaries allow users to query and group weather into larger terms such as ‘typical weather for January at my location based upon 10 years of data’. Let’s examine the options by clicking on Historical Summaries in our query type chooser:
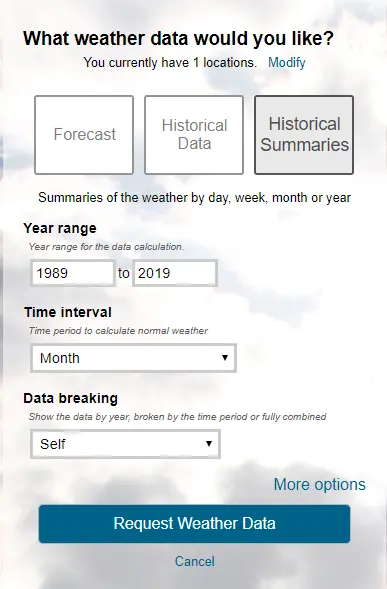
We have 3 main options to work with at the basic level: Range, Interval and Break. Here is a brief overview of those options:
Year range – The year range is the sample period by which the system will pull hourly data and perform its aggregation. By default the system will choose 30 years worth of data and our recommendation is that any additional data will add no significant value for the vast amount of data it will provide. Typically you can even reduce this down to 10 years and still show statistical significance. Another item to consider is that any data before 1970 is probably of lower overall accuracy and quality and for variables other than temperature you may wish to go beyond 1990.
Time interval – The interval in this term is the time unit that will appear on the report. If you want to see the report for each month, then choose month. If you want to see sums for an entire year, then choose year. If we choose a self-breaking report on Month it would look like the following:
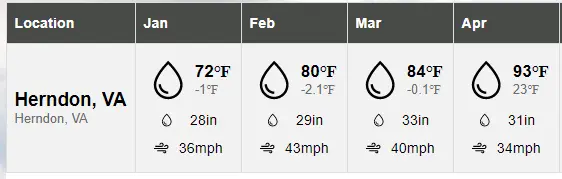
Data Breaking – Breaks are typically a confusing topic for many, to make it simple we will try to give a few examples. Think of breaking as a second time interval. If you want to choose month for ALL data that you have then choose ‘Self’ breaking as we did above. This will take data from all time (limited by our our range setting) and group them into months. However if we want to see the data grouped by our Month interval and see it per-year, then ‘Year’ is the correct breaking choice as we see below:
As a counterpoint to understand this if a user chose ‘Day’ as the Interval and ‘Years’ this query would show the summary for every day for every year. This is the same as standard Historical Summary query and provides no aggregation or reporting value beyond a normal query.
The topic of Historical Summaries is a bit more advanced and can afford the user some great features. Please refer to the following document for a more detailed usage.
Query API
The final action button is the Query API. This button allows this Data Services Page to double as a Query Builder for URL and API users. By clicking on this button you will see the following options.
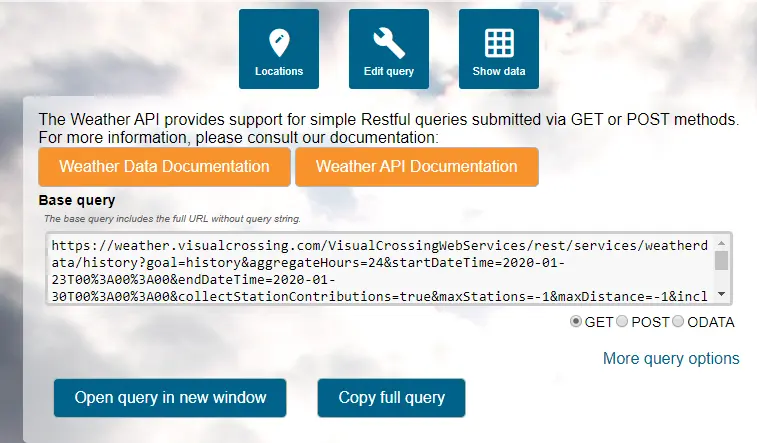
The available options in this window are as follows:
Documentation buttons – The orange buttons at the top will provide the API users with documentation links on how to build a query and utilize it in your code or application.
Base query – The base query is an https query string that can be called from any web-enabled system such as a browser, application or data streaming mechanism. Different forms of the query are available for GET, POST and ODATA scenarios. Simply click on your option and you can use the “Copy full query” button at the bottom to put the URL text into your text buffer and can be pasted anywhere.
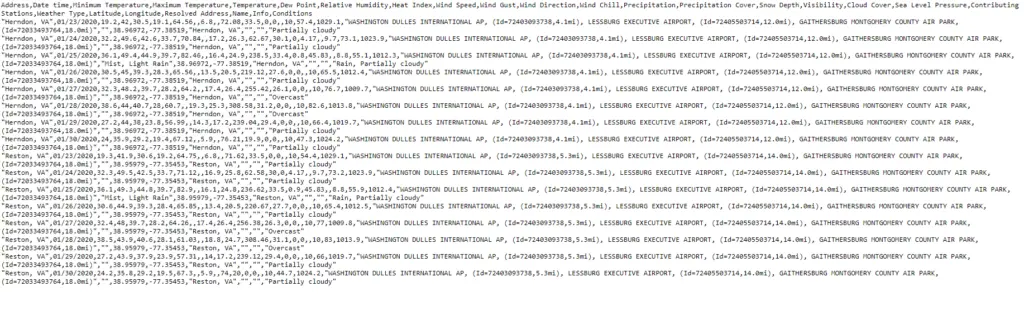
If you want to see the data results prior to pasting into another system, simply choose the “Open query in new window” button and it will paste the text into a new browser tab on your behalf. Here you will see the raw data results in your browser as seen below.
More Query Options – Using the link on the API Query window the user can expose a whole host of additional query options including Unit selection, data format (CSV vs JSON) and more.
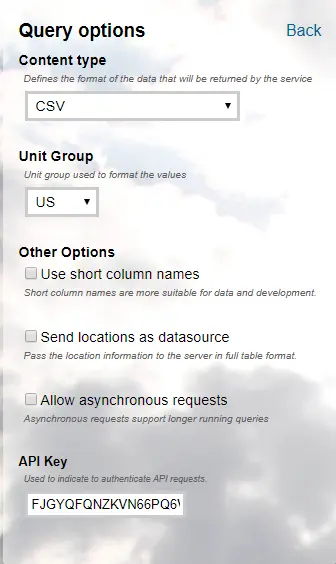
The most important option is the API Key. Paid users with a subscription that supports API usage will be able to use the key found here to include in their automated queries. Usage of the key eliminates the need for session based downloads that require login. Simply pass the key with your requests from your script or application and the system will authenticate automatically.
Users without API privileges can always copy the Base query text and use that in a limited, expiring time frame to pull data into another application using the URL they copied. The expiration is typically less than 10 minutes but is subject to change. The URL that is copied will have all of the same query information embedded in the URL but will have a session token instead of an API key.
To return to the results window at any time simply click on the following button in the API Query builder page.
Additional Sources of Information
For more information, interactive discussions please feel free to join our discussions at
The FAQ can be found at: https://www.visualcrossing.com/resources/frequently-asked-questions-faq-for-visual-crossing-weather-data/