

This article shows how to easily load weather forecast data into Google sheets. It will walk through the process step-by-step showing how to construct the query in Visual Crossing Weather and then use the query URL to import the weather results into Google Sheets.
Also see the companion article that discusses importing historical weather data into Google Sheets.
The estimated time to complete this exercise is about 5 minutes.
Step 1 – Sign in or sign up
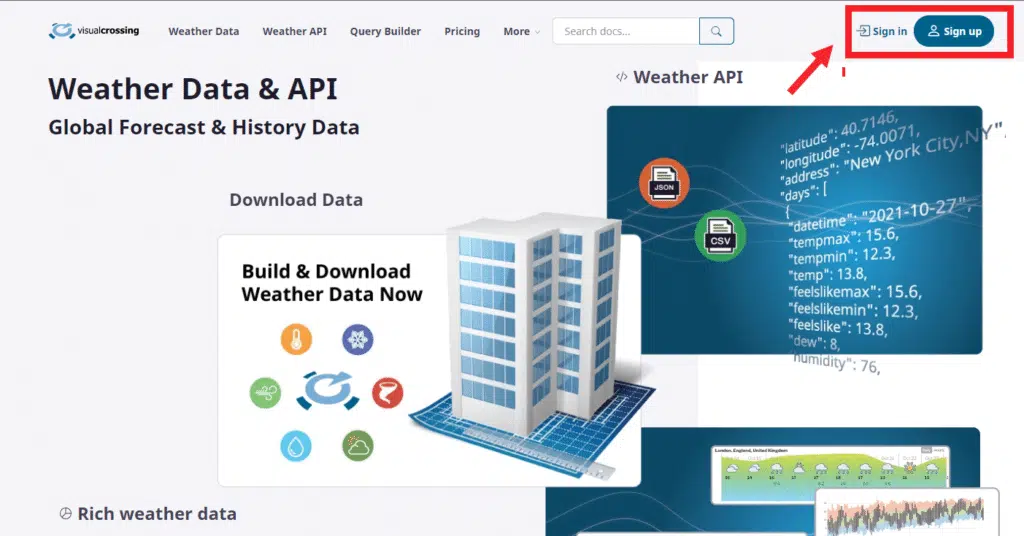
We’ll start by going to the Visual Crossing homepage and logging into our weather account. If you don’t already have a Visual Crossing Weather account you can sign up at this point. The account is entirely free and you can use it to query up to 1000 weather forecasts per day without cost. Your trial account will give you instant access to a full 15-day forecast for any location worldwide.
Step 2 – Open the Query Builder
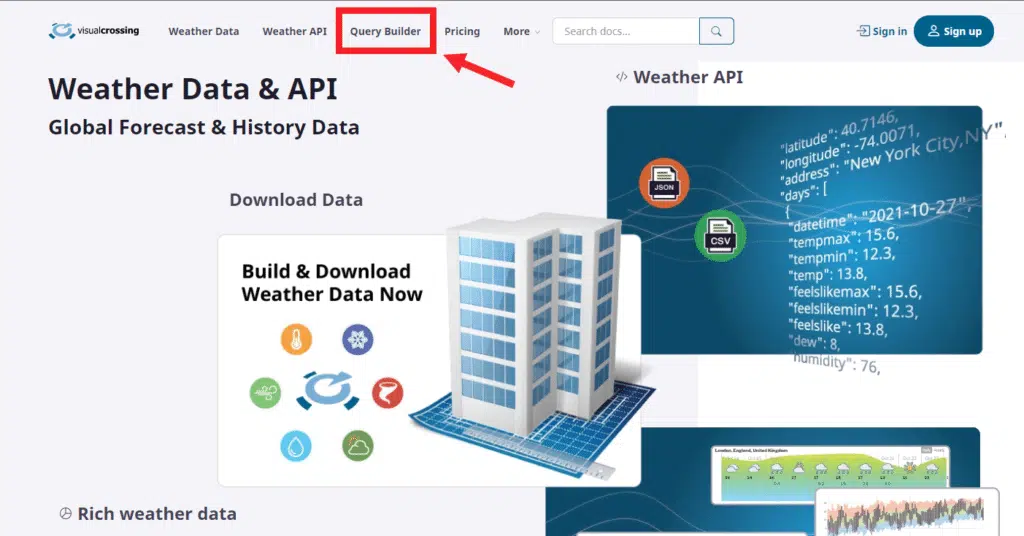
We then need to click on the link to go to weather Query Builder near the top of the page. The Query Builder is where you can create and run weather queries.
Step 3 – Enter you location
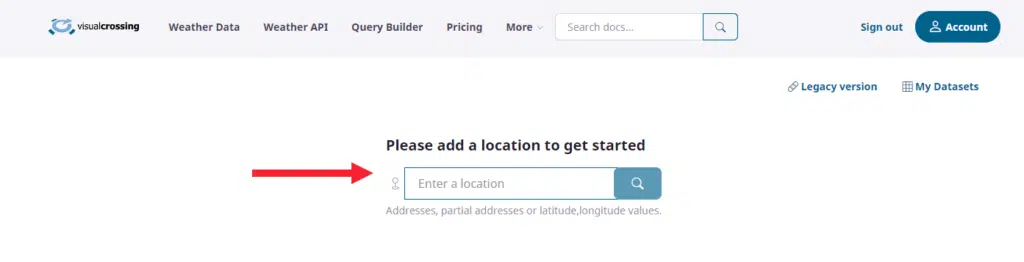
To get started you will need to provide the Query Builder with the location for which you wish to find weather data. This can be as simple as a Zip Code, a latitude/longitude pair in DD format and comma separated, a city name with either state or country for completeness or a full street address of any global location. The value that you enter will be converted to a specific point so that the system can find the weather data for that exact location.
Once you have entered a location, hit the search icon to move on to the next step.
Step 4 – Introduction to the Query Builder
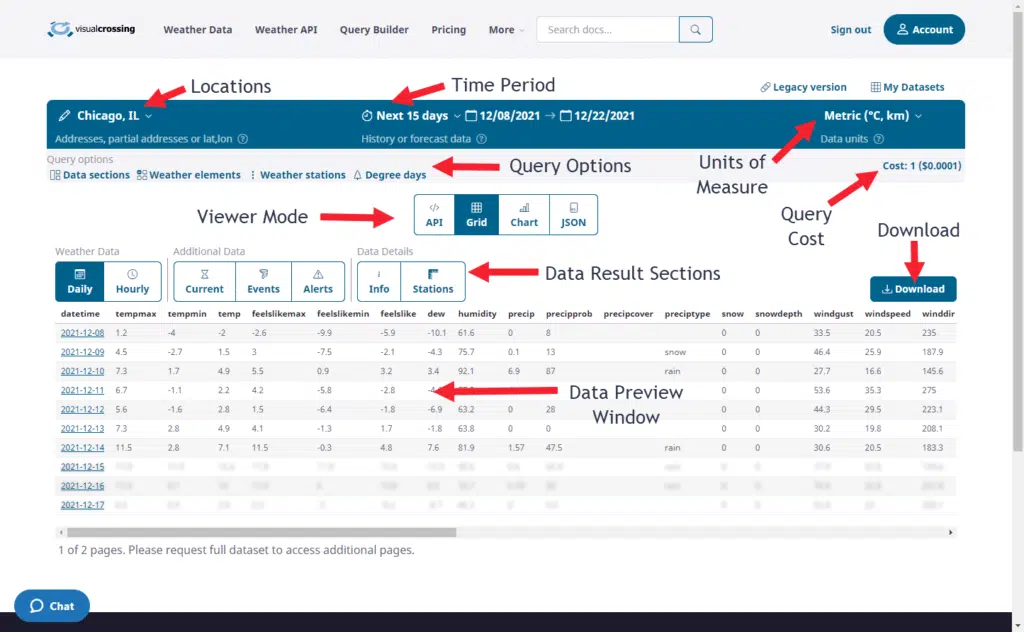
After entering our location we can now see our Query Builder and it has already started a query for you. We will not cover the entire feature usage of the Query Builder in this tutorial but we will refer to the different sections shown in the screenshot above.
Step 5 – Selecting a forecast range
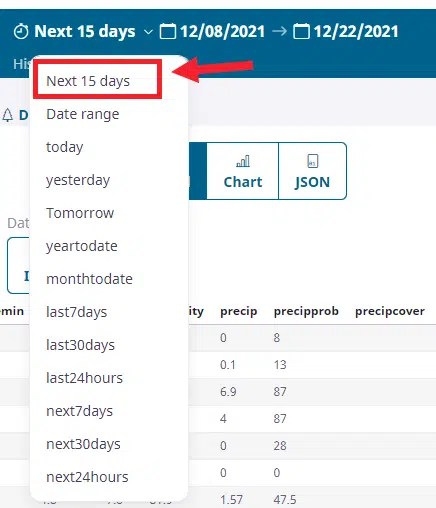
By keeping our selection on the default option of “Next 15 days” we are telling the Query Builder that we want to see a full 15-day forecast for this query. No other date selections are necessary for this option, but you can see that there are many other options available for to explore later. Weather data from the past, present, and future is all available from this simple interface.
We now have finished entering the Location and choosing the 15-day Forecast option for our query.
Step 6 – Previewing your query results
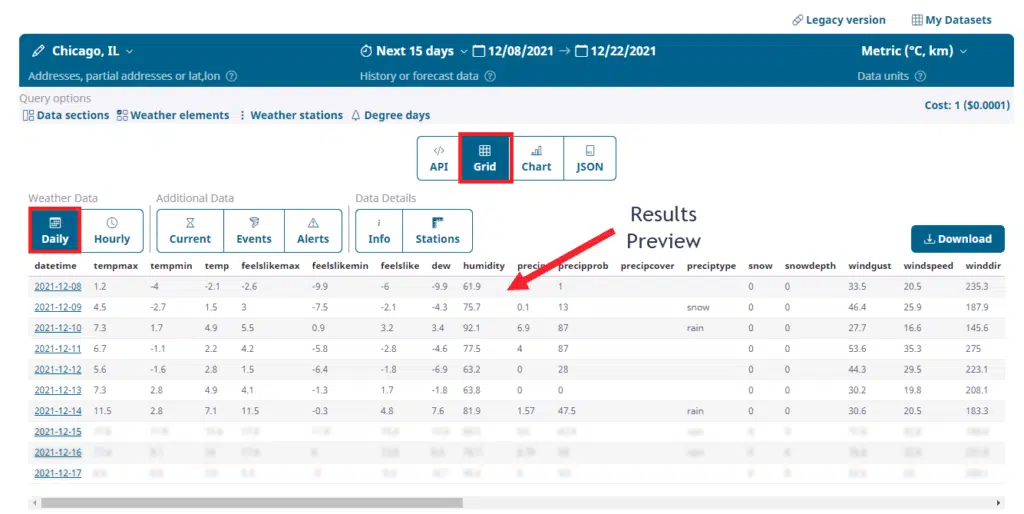
Every time we make a change to the query options, the Preview Window automatically updates with a sample of the result data. By default our view is a grid and our default view is set to “daily” to show us daily results for our forecast on a formatted grid.
Please note that the Preview Window is just a view of the many possible data sets that this query can return. The actual query can bring back more data for different sections including daily weather data, hourly, station info, query information, and can bring back Current Weather, Events and Alerts.
The Viewer Mode buttons can show you other options beyond the Grid. It can show the JSON results in raw form, charts of summary data, and even a copy/paste URL query string that you can paste into a browser or a script for dynamic queries. It is this URL query string that will be used to load our data into Google Sheets.
Step 7 – Obtaining the query URL
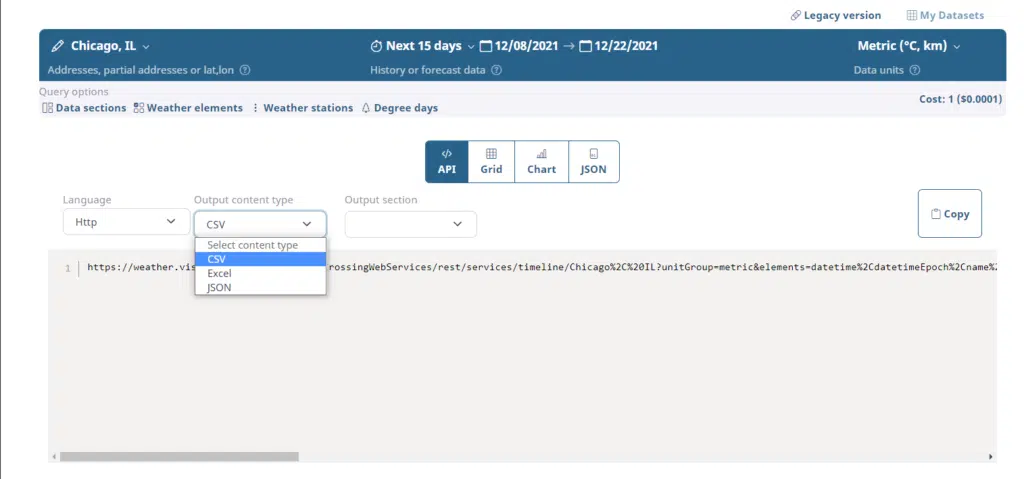
To obtain the query URL that matches this 15-day forecast, simply click on the API button in in the in the View Mode toolbar. This will show you the exact URL that can be used to retrieve the forecast results. Before copying the URL, however, make sure that the Output Content Type is set to CSV. If it isn’t, simply go to the dropdown and change it from its current value to CSV. To copy it to your clipboard, simply hit the Copy button to the right. That will ensure that you have the entire string and didn’t cut off any part.
Note that in the screenshot, the API Key is not shown. However, if you are logged into your Visual Crossing Weather account as instructed above, this URL will already contain the API key associated with your account. This will make it easy to use in Google Sheets. If for any reason, you see a placeholder instead (YOUR_API_KEY) like shown in the screenshot above, simply go into your Visual Crossing Weather account page, copy your API key, and paste it into the URL. Note also that you can easily test this URL by pasting it into any browser window.
Step 8 – Entering the query URL into Google Sheets
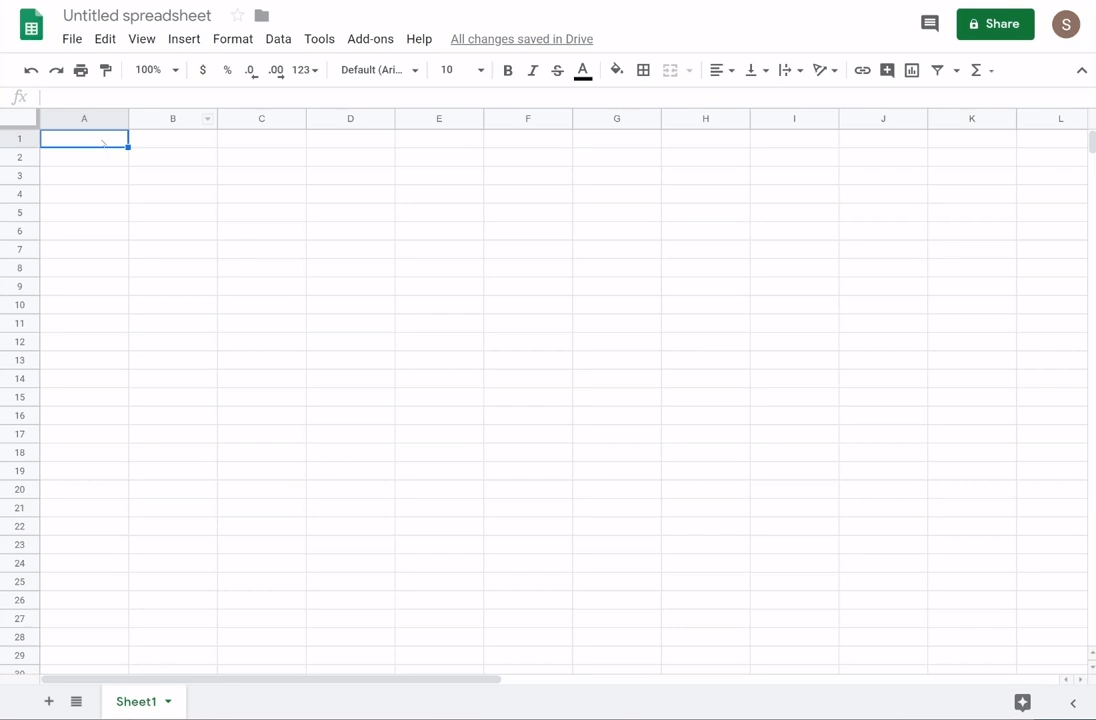
One can now use this URL to load the weather query results directly into Google Sheets. Loading the live result data is as simple as entering the URL into Google Sheets ImportData function. To do so, enter the following into the first sheet cell:
=ImportData(<URL>)
Where the “<URL>” is the value the we copied from the Visual Crossing Weather API page.
NOTE: The Google Sheets =IMPORTDATA function offers 3 parameters (URL, DELIMITER, LOCALE) but only the first parameter is truly required. If you enter =IMPORTDATA(“myURLQuery”) into a cell it is likely to work but in some specific locales for non-US regions it may assume the incorrect delimiter. To make certain that it parses properly you can force all 3 parameters such as:
=IMPORTDATA(“https://weather.visualcrossing.com/VisualCrossingWebServices/rest/services/timeline/Munich,VA/2021-07-10?unitGroup=metric&key=%3CYOUR_API_KEY%3E&contentType=csv&include=days”, “,”, “en_US”)
To be certain that the query parses decimal and separators properly the above sample uses the following format: = IMPORTDATA(“myURLQuery”, “,”, “en_US”)
Step 9 – Formatting the load weather data
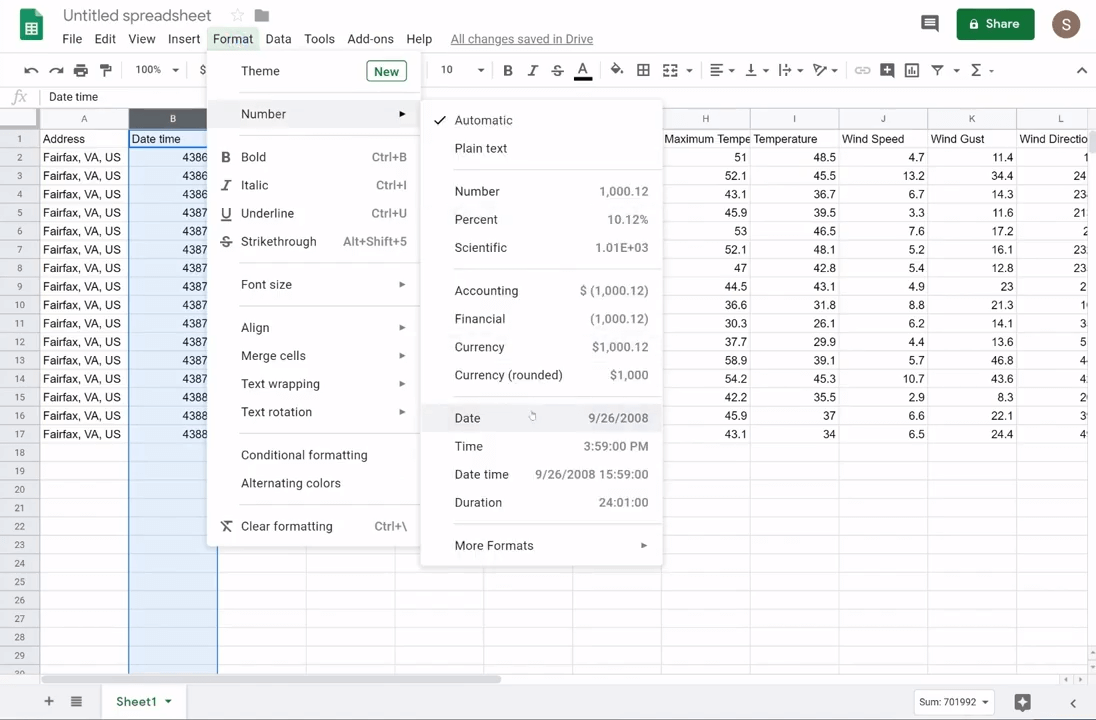
The final step before we can use this data is to format the date column as a Google Sheet date. To do so, simply select the date column and then select the Date option under the Number options in the Format menu.
Now the weather forecast data is loaded and ready for analysis within the Google Sheets environment.
If you would like to learn more about using Visual Crossing Weather options such as history data, multiple location import, and use within other analysis tools please see our other tutorials.
Questions or need help?
If you have a question or need help, please post on our actively monitored forum for the fastest replies. You can also contact our Support Team.