

This article combines multiple frequently asked questions into a single document.
Account Questions
How do I sign up for an account?
To sign up for an account for weather data or weather API access, please visit https://www.visualcrossing.com/weather-query-builder/
On this page, hit ‘Sign up’. You will be prompted for your email (which will be used as your user name). Complete the validation process, enter a password and your account will be created. No credit card or other payment information is required for the free trial.
See How to sign up for a Weather Data & Weather API Account
How can I reset my password?
To reset your account for weather data or weather API access, please visit https://www.visualcrossing.com/weather-query-builder/
On this page, hit ‘Need help signing in?’ You will be prompted for the email that you used to create the account. Complete the password reset validation process and enter the new password.
How can I cancel my account?
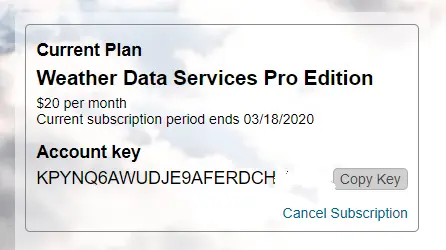
You can cancel your current subscription in the Account Editor after logging in to Weather Data Services.
Alternatively, you may reach out to our Support Team making sure to include the email that was used to sign up for Visual Crossing Weather Data and request a cancellation.
After cancellation, your account will be active until the end of the current billing period.
What are the limits on the weather data trial user account?
The trial is limited to 5 locations within the same request, with up to 100 rows in the data set and up to 50 queries per day. The trial includes up to 15 days weather forecast.
How much does the weather data and weather API cost?
Please see our pricing and editions page.
How can i find my API Key?
Your API key for retrieving weather data via web service can be found in your account details by clicking on the ‘Account’ Button in the top right of the screen. In addition, the API key can be found on the query more details page.
Weather Data Questions
How do I change the units for the weather data?
To change the units for the weather data in the Weather Data Services page, click on the unit selector in the top right of the page:
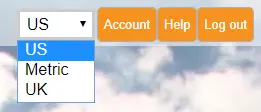
Units are grouped together into regional preferences based on typical US measurements, typical metric measurements and typical UK measurements.
To set this same information in a weather API query, use the ‘unitGroup’ parameter. See the Weather API documentation for more information.
What time zone is the weather data returned in?
Both historical data and weather forecast data are displayed in the local time of the location being queried.
How do I enter a latitude and longitude for my location?
Visual Crossing Weather Data is able to process locations given as an address or with a longitude latitude value. To enter a location by longitude and latitude, enter the values as comma separated decimal values.
For example Washington, DC, USA would be entered as 38.9072,-77.0369.
Note that latitudes south of the equator should be entered as negative (i.e. latitude is a value from -90 at the South Pole to 90 at the North Pole). Longitudes west of the prime meridian (running through London, UK) should be entered as negative (i.e. longitudes from from -180 to 180).
Where is the documentation and sample code for the weather data and weather API?
The documentation for the weather data documentation can be found at Weather Data Documentation.
The documentation for the APIs themselves can be found at Weather API Documentation.
The samples can be found at https://github.com/visualcrossing/WeatherApi.
The weather services page at https://www.visualcrossing.com/weather-query-builder/ can be used to build API queries and view the results directly in the browser.
What’s the difference between historical data and historical summaries?
Historical data are hourly and daily level observations from nearby weather stations.
Historical summaries offers the ability to create summary statistics for the same locations – for example monthly or annual statistics
How do I import weather data into Microsoft Excel?
We offer importing the weather data into Microsoft Excel be using our Excel Add-in or by importing the data using the Excel web import.
For importing the data via the add-in, please review the video at https://youtu.be/dVkT0SZqDCM. For importing using the Excel web import, please review the video at https://youtu.be/lmlSxptJnJY.
How can I see the reporting weather stations when viewing historical weather data?
The historical weather data is created by creating a summary of the weather reports from the surrounding weather stations. This ensures that the weather observation for the requested location is as accurate as possible. In addition this allows for alternative weather stations to be used if a station does not have data for a particular time period. For more information see, How We Process the Historical Weather Data
To include the details of the reporting weather stations in the data output, you can enable the “Include weather station details” setting which can be found in the “Data Options” section of the query builder:
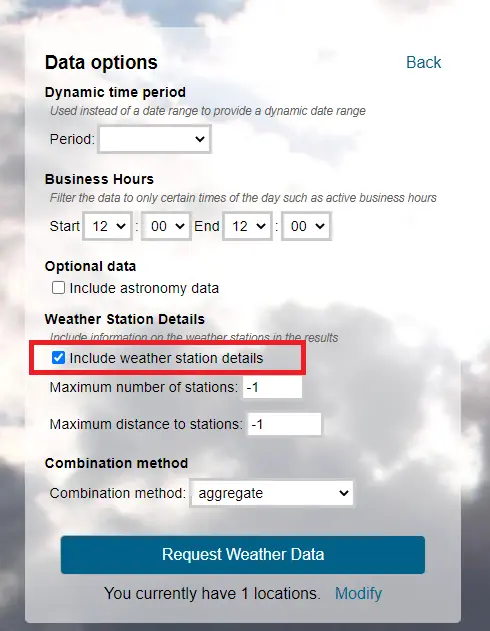
In the weather API, this is setting the “collectStationContributions=true” in the request.
The full output will then include the station details. For example:
WASHINGTON DULLES INTERNATIONAL AP, (Id=72403093738,7.1mi, 100%),
LEESBURG EXECUTIVE AIRPORT, (Id=72405503714,8.7mi, 40%),
GAITHERSBURG MONTGOMERY COUNTY AIR PARK, (Id=72033493764,16.0mi, 11%)
This includes the details of the station, the station ID and the distance to the station.
Note that the “Contributing Stations” column will not be shown unless the full output is displayed when viewing the data in the browser.
How can I control the number and distance to the reporting weather stations for historical weather data?
By default up to 3 weather stations are used to collect historical weather records up to a maximum of 50km or 50 miles away. For some subscription levels, it is possible to control these parameters.
To reduce the number of possible stations, you can change the “Maximum number of weather stations to include” setting. For example setting to this will use only the data for the closest reporting weather station for that particular hour. In the weather API, this parameter is “maxStations”.
To change the maximum distance change the “Maximum distance to weather stations” setting. The value can be increased up to 100km or 100 miles. If the setting is too small, some locations will not report historical weather data as no data can be accessed. In the weather API, this parameter is “maxDistance”
See How Historical Weather Data Records are Created from Local Weather Station Observations
How far back in time does the Visual Crossing Weather historical weather database extend?
The Visual Crossing Weather database extends back to 1970. However, the onset of the most accurate data and the most dense station availability begins in the late 1980s and early 1990s. From the 1990s through to the present day, you will be able to find high-quality and accurate global data.
Much of the modern station network was built starting in the 1960s. So data in the 1970s and 1980s will be less dense in regard to station availability. Also, station maintenance was a problem during this period and some stations go offline for periods while others have periods of reporting erratic results for certain metrics. One common metric victim is precipitation. Visual Crossing’s ingesting and harmonizing process does its best to resolve problems during this period, but data from this era should always be examined a little more closely to ensure that the station(s) being used are close enough to the expected location, and that the most local station(s) do not go offline in the middle of a data set (forcing our system to pick another, less close station).
Although not available in our standard accounts, our weather data sources do provide data back to 1901. If you have a specific need for weather data before 1970, please reach out to us, and we can discuss the options available. You should know, however, that weather data from the 1950s and earlier is available primarily near major urban areas and government installations such as airports and military bases. As the request period gets closer to 1900, the data becomes increasingly sparse. Also, please note that retrieving weather data before 1970 is a more manual process and involves additional fees beyond the normal subscriptions.
See How Historical Weather Data Records are Created from Local Weather Station Observations
What weather variables or elements are available?
Available weather metrics include:
- Temperature – Including maximum, minimum, and average
- Precipitation – Including Precipitation Coverage
- Wind Speed – Including averages and gust data
- Weather type – what was the weather like?
- Humidity and dew point
All weather variables are available at the hourly and daily level. In addition, historical climate reports at the day, week, month and year are available. This allows users to investigate the typical climate for a location and how whether the climate is changing.
What is the height for the wind speed data?
Our wind speed data is measured at the industry standard height of 10 meters (approximately 33 feet) from the ground. We currently do not offer wind data for other heights.
See the weather data documentation for more information.