

In this article, I’m going to show how you can quickly and easily load weather forecast data for any worldwide location into Microsoft Power BI for further analysis.
Visual Crossing Weather enables you to import forecast or historical weather data into Power BI. The data can be imported as CSV or JSON depending on your preference. It is possible to import the data using a live weather API that refreshes against the latest weather data. Alternatively, you can schedule a bulk request to execute on the Visual Crossing cloud and be available for import the data into Power BI afterwards.
We’ll walk through the process step-by-step showing you how to construct the query in the Weather Query Builder and then use the weather API query URL to import the live weather forecast results into Power BI.
Step 1 – construct a query on the Weather Data Services Query Builder
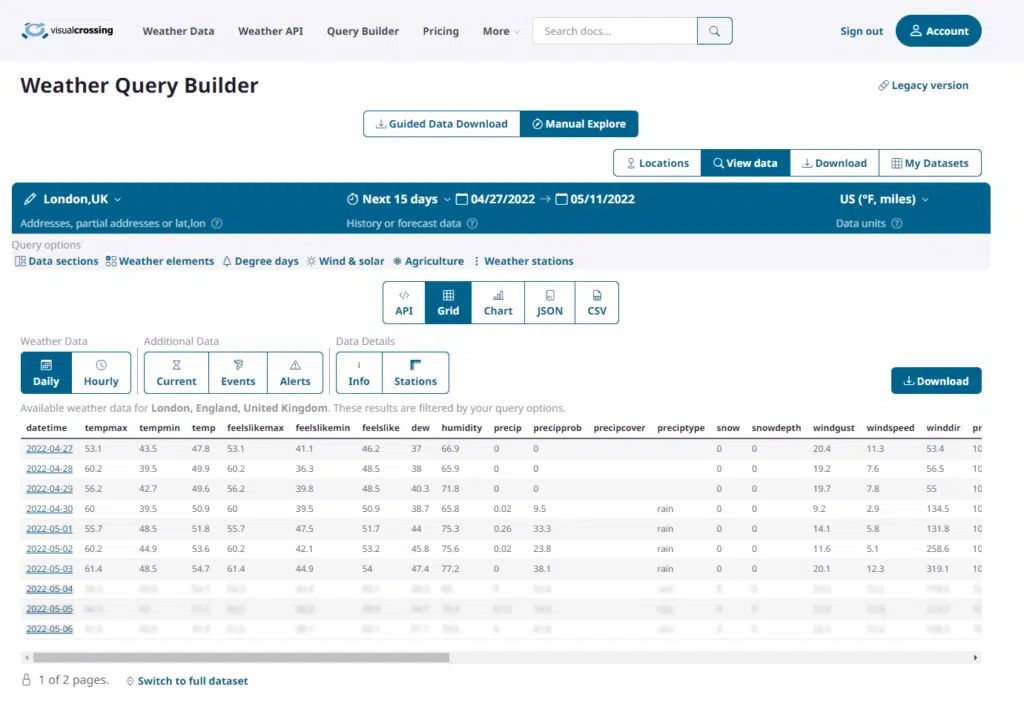
We’ll start by going to the Weather Data Query Page. We can retrieve live data directly into the browser for free on this page. We can also construct the Weather API query or download weather data using this page.
To be able to import live weather data into Power BI we will need to copy the Weather API query. For this we will need to create a free account so we have an API key. For full details on creating queries within the query builder and signing up for an API key, please see our full article on how can I download weather data as a csv file.
Step 2 – create a Weather API query to pull live data into Power BI.
We could now download the data as a CSV file by pressing the “Download” button for manual import into various analysis tools. Downloading the data as a CSV file can by easily imported into Power BI.
However, we’ll switch to the API view to generate the query URL. Using a query URL will allow us to directly import our live weather forecast data into Power BI. This query will allow Power BI to fetch live data and refresh the data so that our forecast data is always current.
To switch to the API view, click on the ‘API’ button in the toolbar:
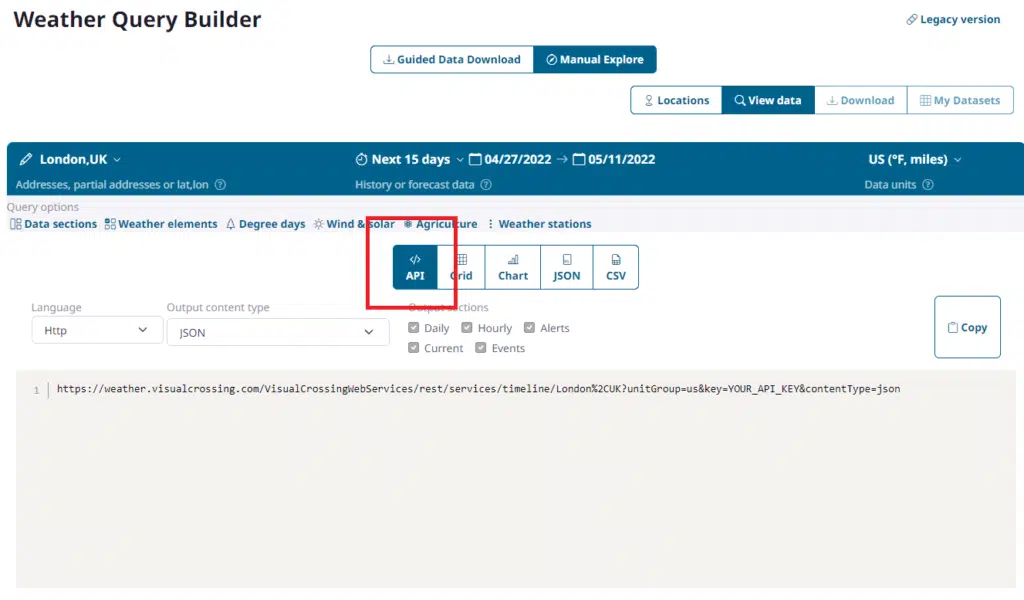
Make sure you are logged into your account at this point so that ‘YOUR_API_KEY’ is replaced with your own personal API key.
Notice that the ‘contentType’ parameter is set to JSON for this query. This is the default value but we also support retrieving CSV formatted data. Both of these can be used for importing live queries into Power BI.
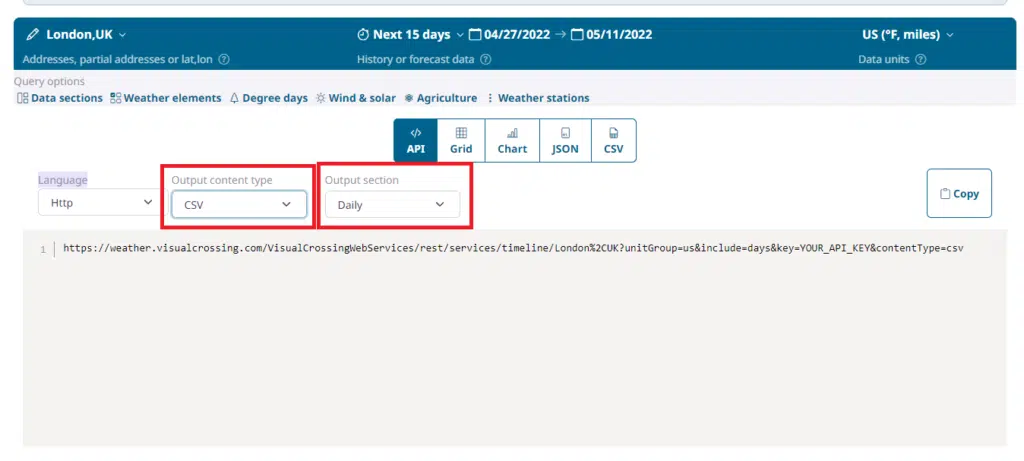
For this example, we will use CSV format as it allows us to focus on the integration and data techniques used within Power BI. JSON format is a powerful format that enables additional functionality that you can consider after successfully using Power BI with CSV data.
To switch to CSV format, simply change the format drop down box. In addition JSON supports only a single data set section (such as daily or daily data). Choose daily data for this example:
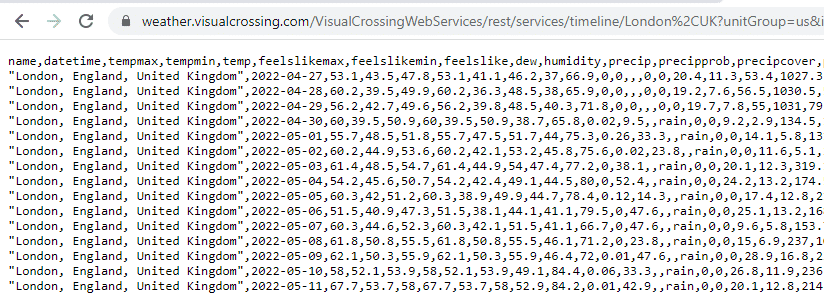
Finally, copy this URL into your clipboard. You can test that the URL returns the correct data by pasting the URL directly into a browser:
Step 3 – import the data into Power BI
When we start Power BI, we are presented with a blank document.
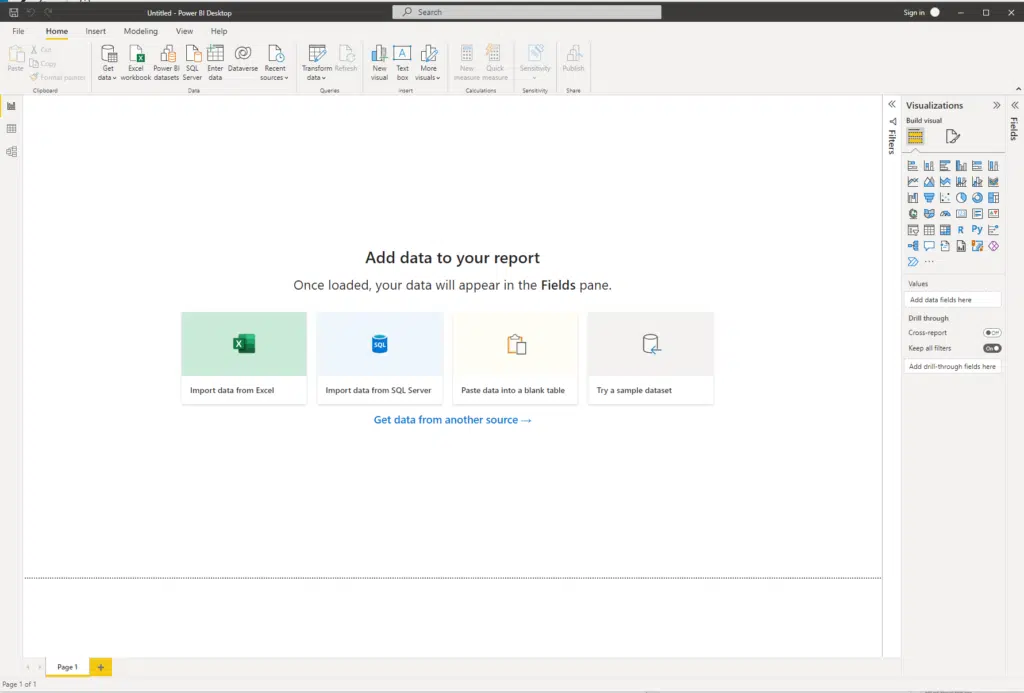
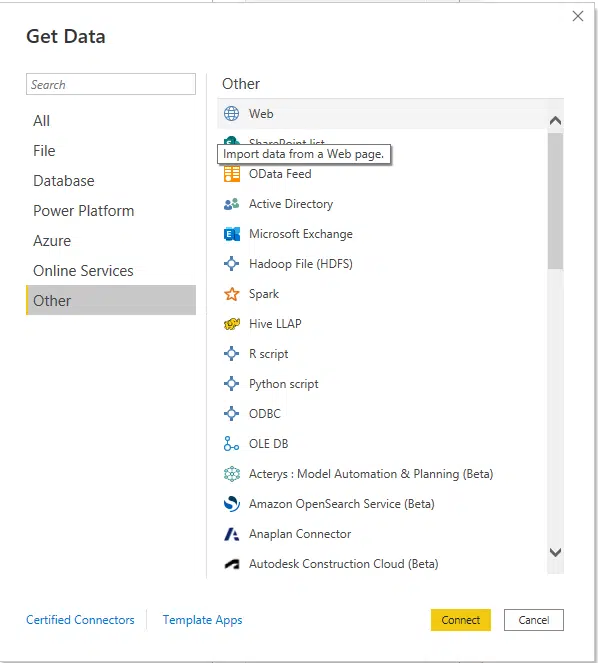
Click on ‘Get data from another source’ to popup the connector dialog. From this dialog, click on ‘Other’ then ‘Web’.
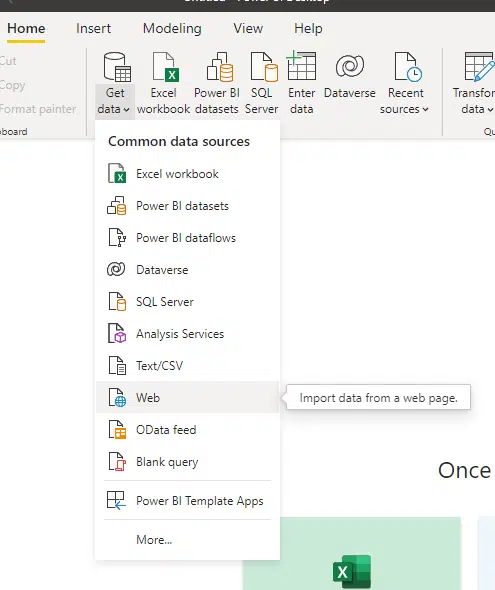
Alternatively, you can access the Get Data -> Web from the toolbar by clicking ‘Get Data’ and then web.
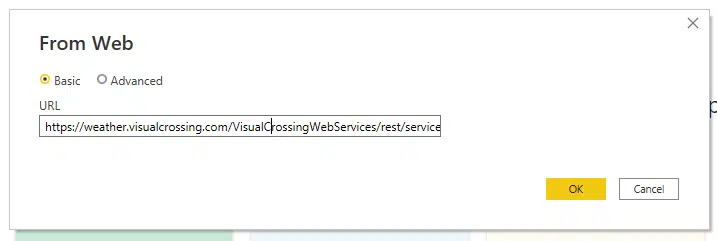
Power BI will open a prompt asking for the URL from which to fetch the data. Since we already have the query URL copied, we can paste it directly into the URL box and click the OK button to submit the query.
In certain cases, such as when first accessing the weather API, Power BI may show an authentication popup box:
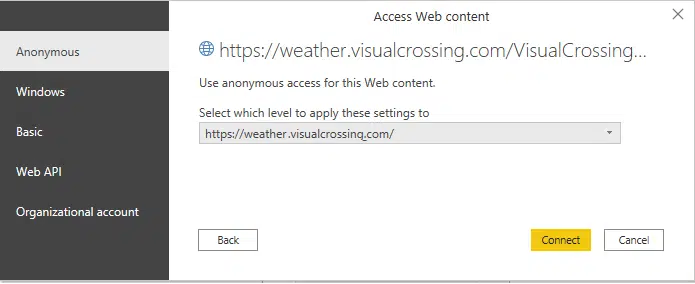
I this case, choose the ‘Anonymous’ option on the left and hit ‘connect’
Step 4 – review the data preview and modify data types as necessary
Power BI will now run the weather data query and show us a sample of the results in a preview window. We can see that our forecast query returned many weather elements including temperature, precipitation and wind speed. These elements are reported for every day during the 15-day forecast period.
As we chose CSV as our data format type, Power BI makes educated guesses on the format of the data including the data type of each of the column elements. Review that the file origin is marked as ‘UTF-8’, the delimiter is marked as ‘Comma’. Also review the data types assigned. You can modify them manually if the automatic detection is not correct.
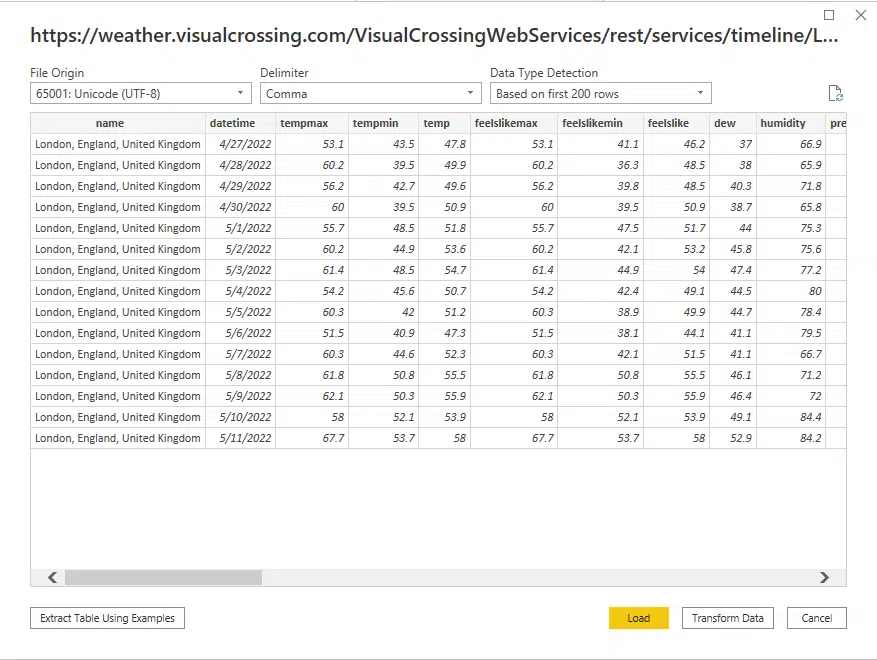
Once you have reviewed the data, hit ‘Load’ to retrieve the data into Power BI for analysis.
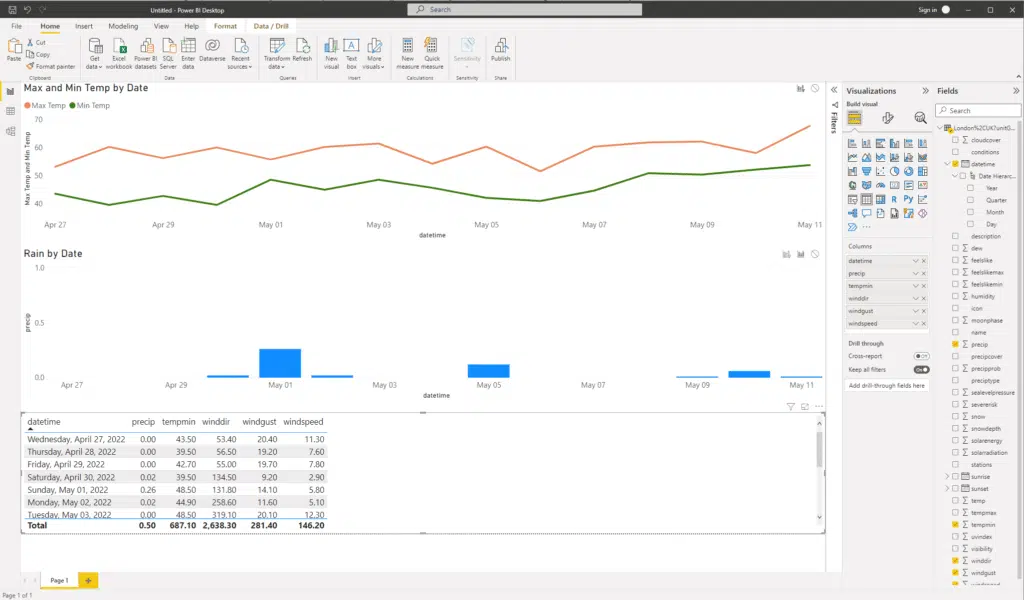
Step 5 – perform analysis in Power BI
When we click on the Load button, Power BI will fetch the entire forecast dataset and make it available for analysis. Once loaded, we can immediately begin using our weather data in our Power BI analyses. We can not only analyze the data directly, we can correlate weather with existing business data to make and adjust plans such as staffing levels, supply levels, optimal operating hours, and more.
If you would like to learn more about using Visual Crossing Weather options such as history data, multiple location import, and use within other analysis tools please see our other tutorials.
Using a scheduled query rather than a live query
In the above steps, we integrated a live weather API request into the Power BI document. In some cases, it is preferable to import data from a scheduled dataset rather than a live weather API query. The data format will be the same and so integration is just as easy. Scheduled queries are particularly useful when you need data for many locations as the schedule will run the data for all the locations. For more information on using scheduled queries, please see How to schedule weather queries.
Questions or need help?
If you have a question or need help, please post on our actively monitored forum for the fastest replies. You can also contact our Support Team.