

This article shows how to import data into Microsoft Excel using Power Query from a RESTful Weather API. This API returns JSON-based data. We are also going to explain how to create a loop within our script so that we can call the API multiple times for multiple locations and create a combined result table in our Excel worksheet.
To download the example workbook for this guide, please see the sample in our code repository at:
Steps to import JSON data from RESTful API into Microsoft Excel
Here are the steps we will take:
- Choose a Weather API and create a sample query.
- Create a Power Query script in Microsoft Excel to import the data and create a table.
- Add a loop around multiple locations to demonstrate how to append multiple tables together
- Add parameters to the Power Query script so that we can make changes in Excel and have the data update automatically
Step 1 – Choose an API and create a sample query
We are going to use the Visual Crossing Weather API. This free API provides simple access to historical weather data as well as weather forecast. Before we can use the API, we have to create a free account. To do this, head over to the Weather Data Services page. In addition to creating your account, you can also create sample Weather API queries.
We will be using the Timeline Weather API that provides seamless access to historical and forecast weather. Here’s the sample weather API request we will model our Power Query Script around:
https://weather.visualcrossing.com/VisualCrossingWebServices/rest/services/timeline/Paris,France/2021-2-1/2021-2-17?unitGroup=us&key=YOUR_API_KEY
The items in bold are parameters for the location, date range and units of measurement – we will add a way for the user to modify these easily.
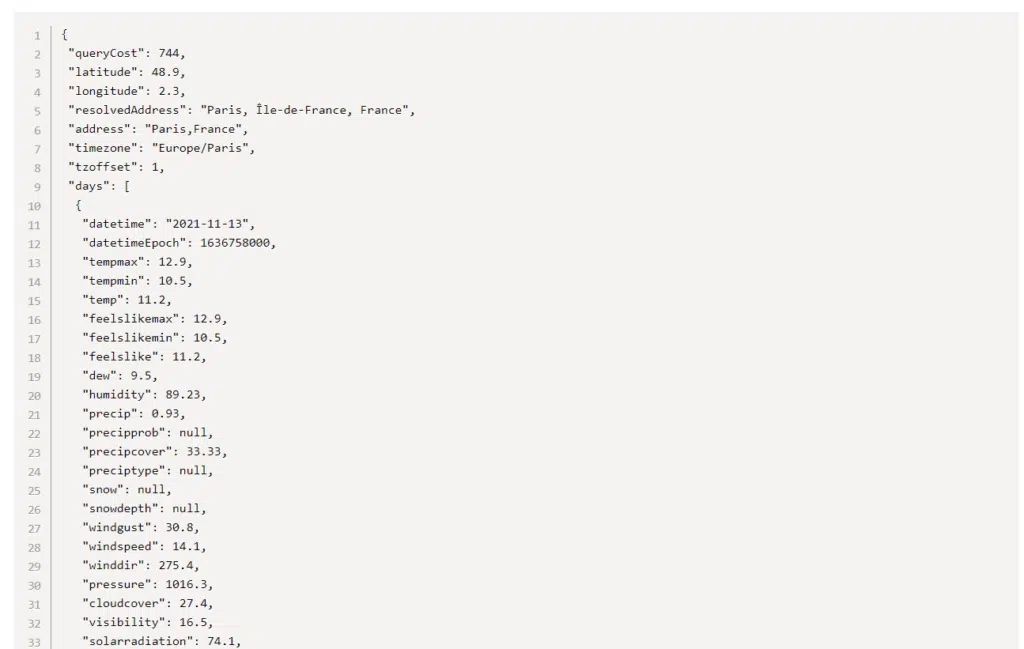
The above API request returns JSON formatted data. Here is sample of the data:
For full documentation on this Weather API, head over to the full Timeline Weather API documentation.
Step 2 – Create a Power Query script
Now that we have our Weather API query, we can start creating the Power Query script that will import the data into Excel. As Power BI also supports Power Query, you can also use these same concepts to import data into Power BI.
Here’s our first Power Query script:
let
ApiQuery="https://weather.visualcrossing.com/VisualCrossingWebServices/rest/services/timeline/paris%2Cfr/2021-2-1/2021-2-17?unitGroup=us&key=YOUR_API_KEY",
RawData=Web.Contents(ApiQuery),
JsonResult = Json.Document(RawData),
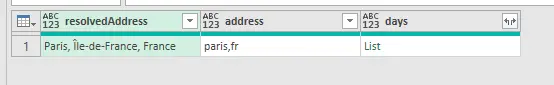
QueryResult= Table.FromRecords( { JsonResult } , {"resolvedAddress", "address", "days"})
in
#"QueryResult"This simple script simply retrieves sets up the variable ‘ApiQuery’ to contain the URL to the Weather API query, retrieves the contents (using Web.Contents). After retrieving the data, the script parses the result as JSON and creates a basic table output consisting of three columns – ‘resolvedAddress’, ‘address’ and the days array.
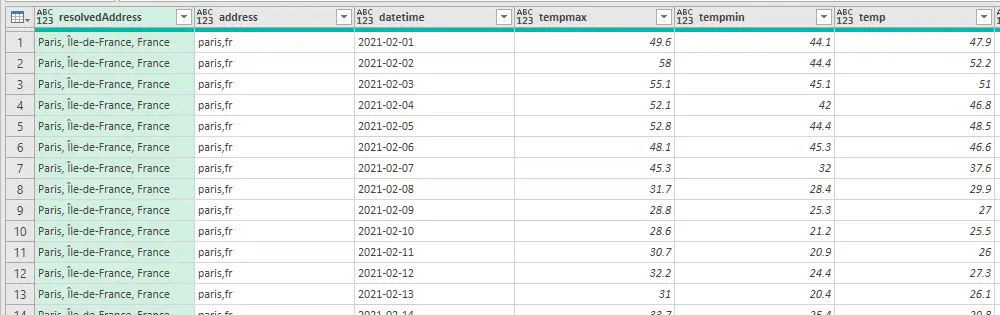
The ‘days’ list contains a list of multiple elements – one for each day of our weather data request representing the weather for that day. We would like to expand this array as rows of the output table. To do this, we add a few more lines to our script:
let
    ApiQuery="https://weather.visualcrossing.com/VisualCrossingWebServices/rest/services/timeline/paris%2Cfr/2021-2-1/2021-2-17?unitGroup=us&key=YOUR_API_KEY",
    RawData=Web.Contents(ApiQuery),
    JsonResult = Json.Document(RawData),
    QueryResult= Table.FromRecords( { JsonResult } , {"resolvedAddress", "address", "days"}),
    ExpandDaysAsRows = Table.ExpandListColumn(QueryResult, "days"),
    QueryResultExpanded = Table.ExpandRecordColumn(ExpandDaysAsRows, "days", {"datetime", "tempmax", "tempmin", "temp", "feelslikemax", "feelslikemin", "feelslike", "dew", "humidity", "precip", "precipprob", "precipcover", "preciptype", "snow", "snowdepth", "windgust", "windspeed", "winddir", "pressure", "cloudcover", "visibility", "solarradiation", "solarenergy", "sunrise", "sunset", "moonphase", "conditions", "source"},
              {"datetime", "tempmax", "tempmin", "temp", "feelslikemax", "feelslikemin", "feelslike", "dew", "humidity", "precip", "precipprob", "precipcover", "preciptype", "snow", "snowdepth", "windgust", "windspeed", "winddir", "pressure", "cloudcover", "visibility", "solarradiation", "solarenergy", "sunrise", "sunset", "moonphase", "conditions", "source"})
in
    #"QueryResultExpanded"
There are two steps to expanding the day rows. First we use ‘ExpandListColumn’ to expand the days list into multiple rows. Next we use ‘ExpandRecordColumn’ to expand each of the day records into multiple columns we would like on our output table. We provide a list of parameters to expand and how we would like to set the column names of our table.
Step 3- Add a loop around multiple locations to append multiple tables using Power Query
We now have the weather data for a single location loaded into Excel. Let’s create a merged table of weather data for multiple locations. Conceptually this is simple – run the above Weather API query multiple times and join the tables together!
To do this, we first create a Power Query method based on the above script. We can then call this in a loop to create the combined results:
let
    WeatherApi.Results = (location) => let
        ApiQuery="https://weather.visualcrossing.com/VisualCrossingWebServices/rest/services/timeline/" & location & "/2021-2-1/2021-2-17?unitGroup=us&key=YOUR_API_KEY",
        RawData=Web.Contents(ApiQuery),
        JsonResult = Json.Document(RawData),
        QueryResult= Table.FromRecords( { JsonResult } , {"resolvedAddress", "address", "days"}),
        ExpandDaysAsRows = Table.ExpandListColumn(QueryResult, "days"),
        QueryResultExpanded = Table.ExpandRecordColumn(ExpandDaysAsRows, "days", {"datetime", "tempmax",...}, {"datetime", "tempmax",...})
    in
        #"QueryResultExpanded",
        FinalMergedResults=WeatherApi.Results("Paris,France")
in
    FinalMergedResults
In this script, we’ve moved the above code into a function called ‘WeatherApi.Results’ which we call with a text location (“Paris, France”). Notice that we now add the location into ApiQuery variable dynamically so we can easily call the function with different location addresses. The result of this stage is the same – the weather for Paris, France.
So now we call our function in a loop and append the results:
let
WeatherApi.Results = (location) => let
ApiQuery="https://weather.visualcrossing.com/VisualCrossingWebServices/rest/services/timeline/" & location & "/2021-2-1/2021-2-17?unitGroup=us&key=YOUR_API_KEY",
RawData=Web.Contents(ApiQuery),
JsonResult = Json.Document(RawData),
QueryResult= Table.FromRecords( { JsonResult } , {"resolvedAddress", "address", "days"})
in
#"QueryResult",
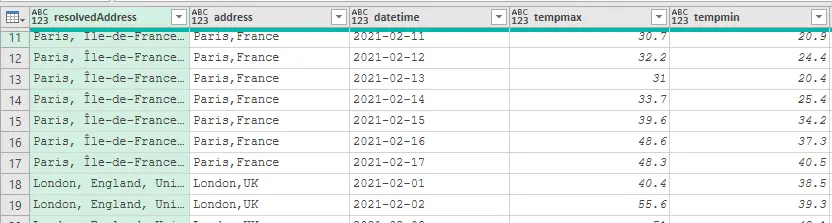
Locations=Table.FromRows({{"Paris,France"}, {"London,UK"}, {"Hamburg,Germany"}}, {"Location"}),
InsertedResults = Table.AddColumn(Locations, "Results", each WeatherApi.Results([Location])),
AllResults=Table.Column(InsertedResults, "Results"),
CombinedResults = Table.Combine(AllResults),
ExpandDaysAsRows = Table.ExpandListColumn(CombinedResults, "days"),
FinalMergedResults = Table.ExpandRecordColumn(ExpandDaysAsRows, "days", {"datetime", ...}, {"datetime", ...})
in
FinalMergedResultsIn this script we loop through a list of locations created directly in the script. We then ‘WeatherAPI.Results for each item in the list using the ‘each’ method.
These results are combined together using ‘Table.Combine’. Note that the expansion of the days and columns has been moved outside of the method and is performed after the tables have been combined.
Step 4 – Add parameters to the Power Query script
Finally we’d like to add some parameters to our script so that we can change parameters on a Excel sheet and provide a list of locations. This will be a lot easier than editing the script every time!
To create the parameters we will create a series of named ranges in Excel. Then we can references those named ranges in the script. First we create a series of single-cell named ranges for each of the API parameters.
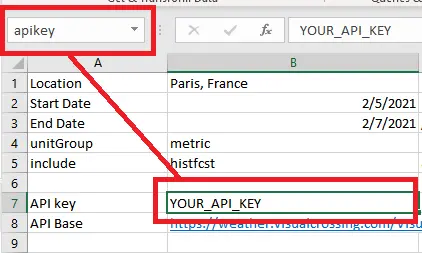
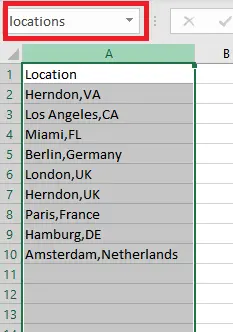
Now we create a range for a full Worksheet column to read the list of locations. We create a named range called ‘locations’:
Now we can modify our script to use these named ranges. Within our function, we create the ApiQuery from these parameters:
//read the parameters from the Workbook named ranges
apibase=Excel.CurrentWorkbook(){[Name="apibase"]}[Content]{0}[Column1],
startdate=Excel.CurrentWorkbook(){[Name="startdate"]}[Content]{0}[Column1],
enddate=Excel.CurrentWorkbook(){[Name="enddate"]}[Content]{0}[Column1],
unitGroup=Excel.CurrentWorkbook(){[Name="unitGroup"]}[Content]{0}[Column1],
key=Excel.CurrentWorkbook(){[Name="apikey"]}[Content]{0}[Column1],
include=Excel.CurrentWorkbook(){[Name="include"]}[Content]{0}[Column1],

//construct the ApiQuery by appending the parameters
ApiQuery=apibase & location &
  (if startdate<>"" then "/" & DateTime.ToText(startdate,"yyyy-MM-ddThh:mm:ss") else "") &
  (if startdate<>"" and enddate<>"" then "/" & DateTime.ToText(enddate,"yyyy-MM-ddThh:mm:ss") else "") &
  "?unitGroup=" & unitGroup & "&key=" & key &
   (if include<>"" then "&include=" & include else ""),
The second part of the parameterization reads our list of locations:
 Locations=Excel.CurrentWorkbook(){[Name="locations"]}[Content],
 #"Filtered Rows" = Table.SelectRows(Locations, each [Column1] <> null and [Column1] <> ""),
#"Promoted Headers" = Table.PromoteHeaders(#"Filtered Rows", [PromoteAllScalars=true]),

InsertedResults = Table.AddColumn(#"Promoted Headers", "Results", each  WeatherApi.Results([Location])),
Reading the list of locations from the location range is a multi-step process. First we read access the named range. Then we filter down the rows to remove the null values. Finally we use the first row as the header. We can then pass the list to the Table.AddColumn method that we had from our previous step.
We now have a fully parameterized, multiple location RESTful API example that reads from a JSON-based Weather API and merges the result into a single table.
Questions or need help?
If you have a question or need help, please post on our actively monitored forum for the fastest replies. You can also contact our Support Team.