

When we need to know what will happen with the weather in the next couple of weeks, we can turn to the traditional weather forecast. The standard weather forecasts are based around computer models that simulate what will happen with the weather over the next few weeks.
But what happens when you aren’t interested in the next few weeks? Perhaps you are planning wedding, a vacation or outdoor event and you need to know what will the likely weather be on a given location and date further into the future. In that case we use historical weather observations collected over many years to help us understand the likely weather we will experience.
In this article we will use the Historical Weather Summary statistical weather analysis queries to create a picture of what the weather for a given will likely be like.
If you are interested in seeing how we can use this data, check out the Average Weather Dashboard which uses the historical weather summary data sets described in this article to display the typical weather for a location.
What statistical weather information do we want to know?
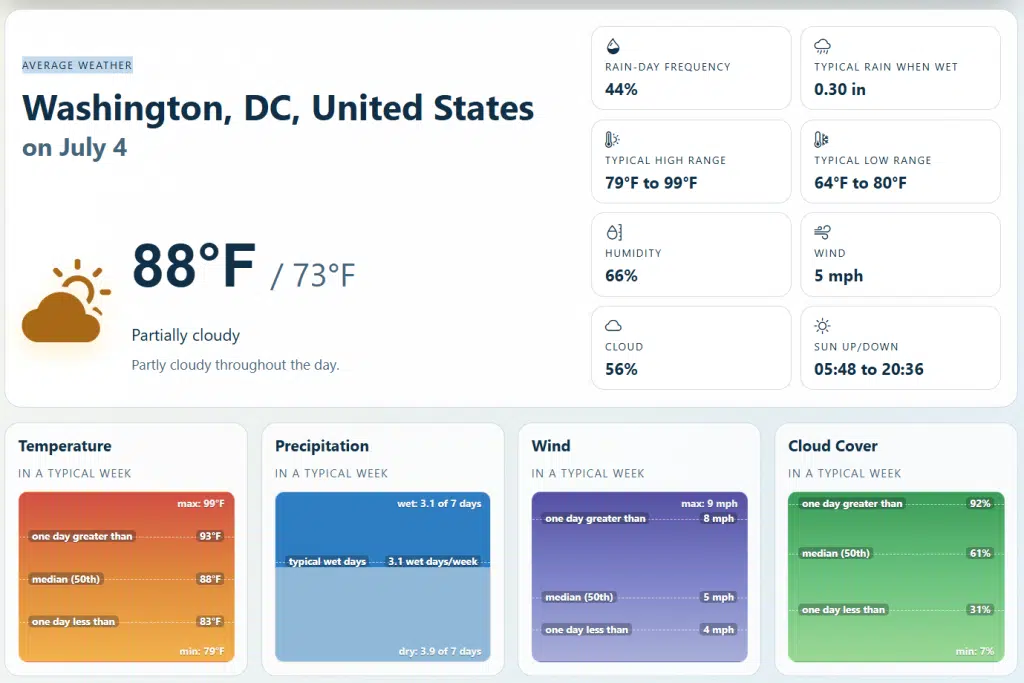
When creating statistical weather data-based forecasts, we need to find a the typical weather conditions for that location. For example, we would like to know the average high temperature, average low temperature and how likely it is to rain.
However this does not give us the full picture. If I am planning a possible vacation I need to know not only the normal weather but also the worst and best weather I might expect. If I am I am planning an outdoor event such as wedding, what is the likelihood that it might rain? And how much rain?
Knowing the historical weather ‘normals’ is interesting but we need to know how likely is it that the weather is significantly warmer or cooler than the average? We need to understand the complete picture – what is the normal weather, what is the worst weather possible and what is the best weather possible? And how likely is it that the more extreme weather might happen?
if we compare two locations, we can see how this might affect our planning. Here is the predication for July 4th in Honolulu, HI
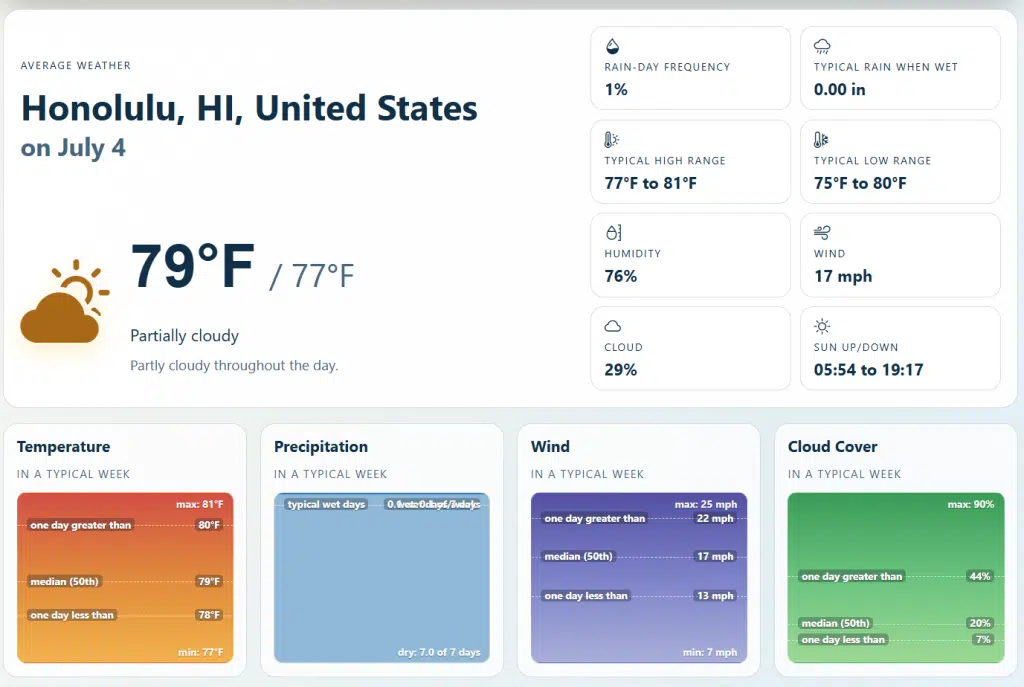
Notice how the normal Daily High for Washington, DC is much more variable – with possible swings in temperature from 77F to 99F whereas Honolulu swings in the fairly small range of 77F to 81F. The wide orange band of the typical weather (5 days out of the week) illustrates this by it’s larger size for Honolulu compared to Washington, DC.
Constructing the historical summary request
Now we have seen the possibilities of this kind of statistical weather request, we can construct these kind of queries ourselves. We will be using Weather Data Services to construct the requests. If you are not familiar with using Weather Data Services or have not set up an account, please see our Getting Started With Weather Data Services article.
In order to use the statistical summary editor as in the definition below you will need to access the web interface by clicking the “Statistics” link on the query builder page as in the screenshot below. Note that we chose a date range of 46 years to get a longer range of average weather data for Washington DC.
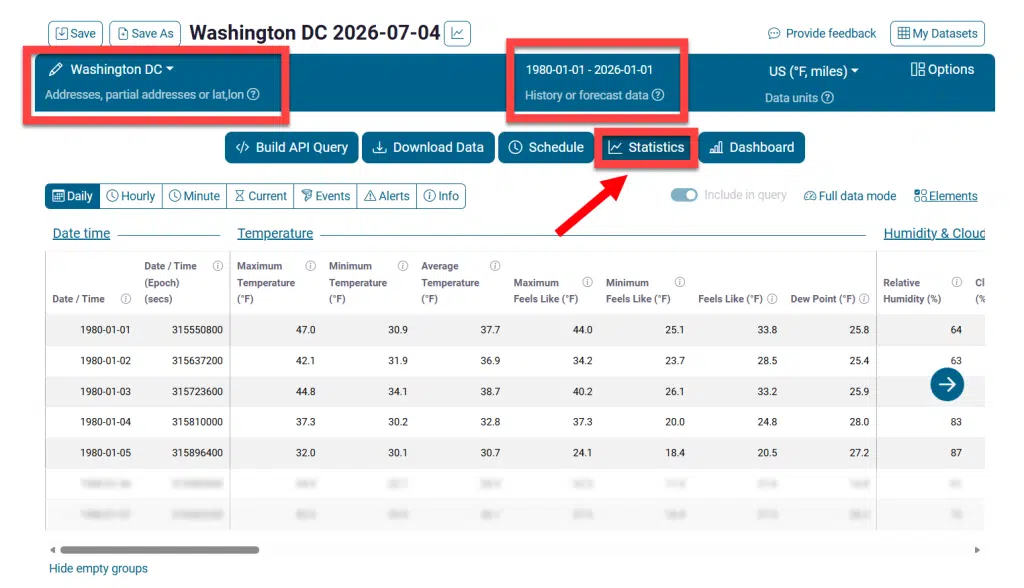
We will now create a Statistical Summary request. For more on Historical Summary requests, please see the How to create annual or monthly climate summaries and normals for a location article. In this case we are going to focus on a daily summary to see the data for all days of year… including July 4th. Click on the ‘Statistics’ button to get started and then choose to create a “Statistical Summary”.
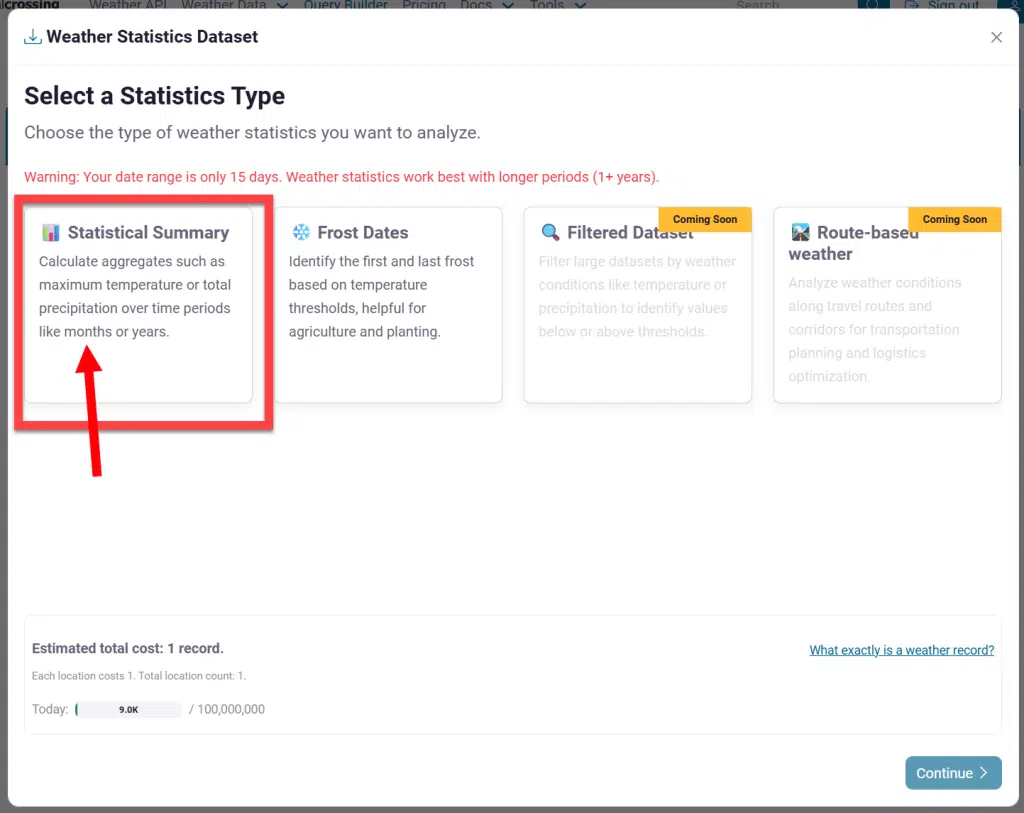
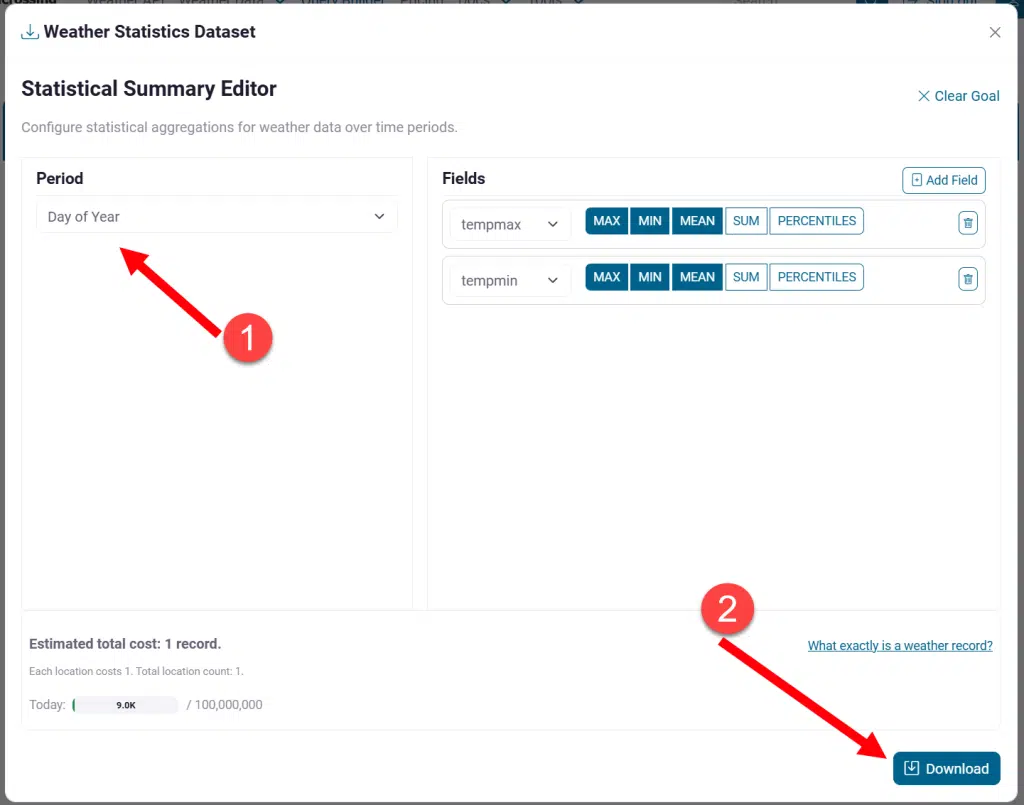
With this basic request for all days across all years we choose “Day of Year” and since the default fields for elements is already tempmin and tempmax we can simply click download to get our CSV/Excel results.
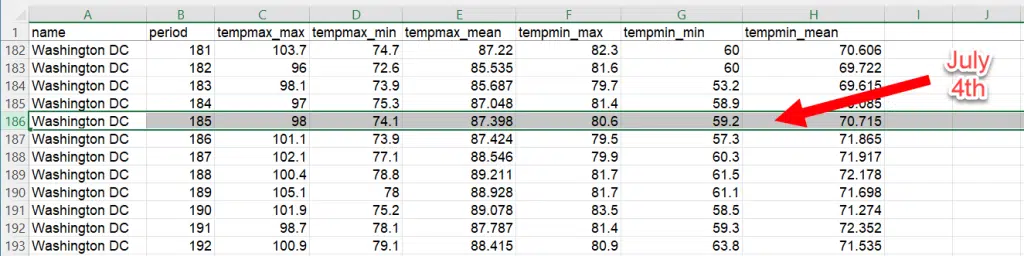
We can now see our results. We can see the 46-year statistical average of our temperatures in Washington DC by each day. Day 185 is our July 4th date. You can see by adding another 20 years that the averages can adjust fairly significantly. If your goal is to understand Max or Min values for a region, having this ability to go farther back in time can be important.
Using Microsoft Excel or other data analysis technique we can drill into this data to understand exactly the likely hood of certain weather conditions occurring.
More reading
This article introduces some of the more sophisticated features of the historical summary reports available through the Visual Crossing Weather Data platform. You can integrate these queries into your own applications and databases via the Weather API.