

This article shows the necessary steps to quickly and easily load weather forecast data for any location of the world into Tableau Desktop for further analysis. The tutorial shows step-by-step how to construct the query in the Visual Crossing Weather web interface and then import the weather forecast results as csv file into Tableau Desktop.
If you are interesting in how to import historical weather data into Tableau, be sure to check out our second blog describing how to import weather history data into Tableau.
Step 1 – Start with the Web-based Query Builder
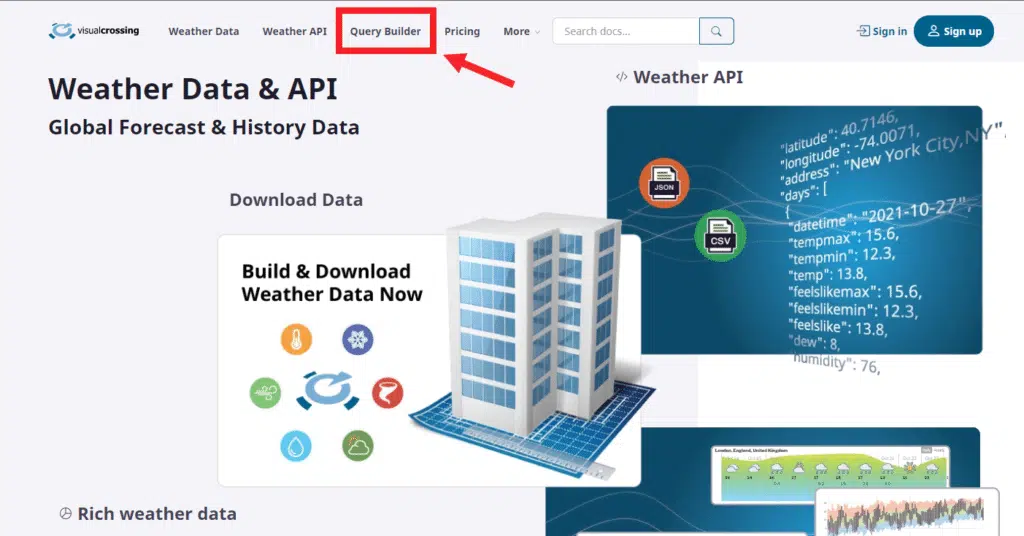
If you don’t already have a Visual Crossing Weather account, you can create one for free. Simply following our article that details the sign up steps. Once you are logged in, go to our web-based Query Builder where you can easily build your weather data query.
When you visit the Query Builder for the first time, the system will ask that you provide a location for your for your weather query. Note that if you have used Query Builder before, your previous location will already be loaded.
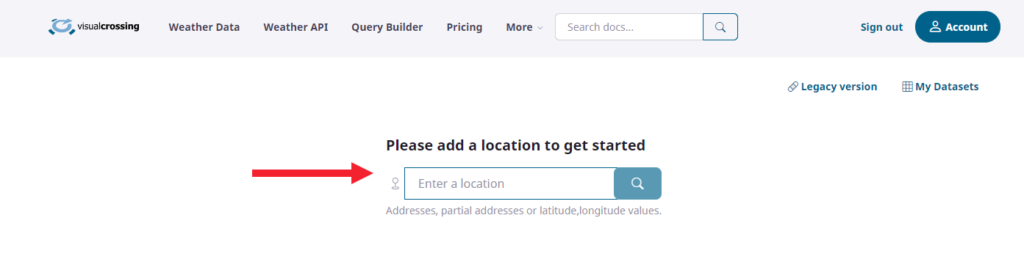
You can provide Query Builder with any location from anywhere in the world. This is the location for which you wish to query weather data. The can be as simple as a ZIP Code (90210), a latitude/longitude pair in DD format and comma separated, city name, or a full street address. This location that you enter will be geocoded if necessary to a specific point. The Weather Engine will then use this point for find the specific weather data for that exact location. The more specific you make the location that you provide, the more accurate your weather data can be.
Once you enter the location, hit the search icon to move to the next step.
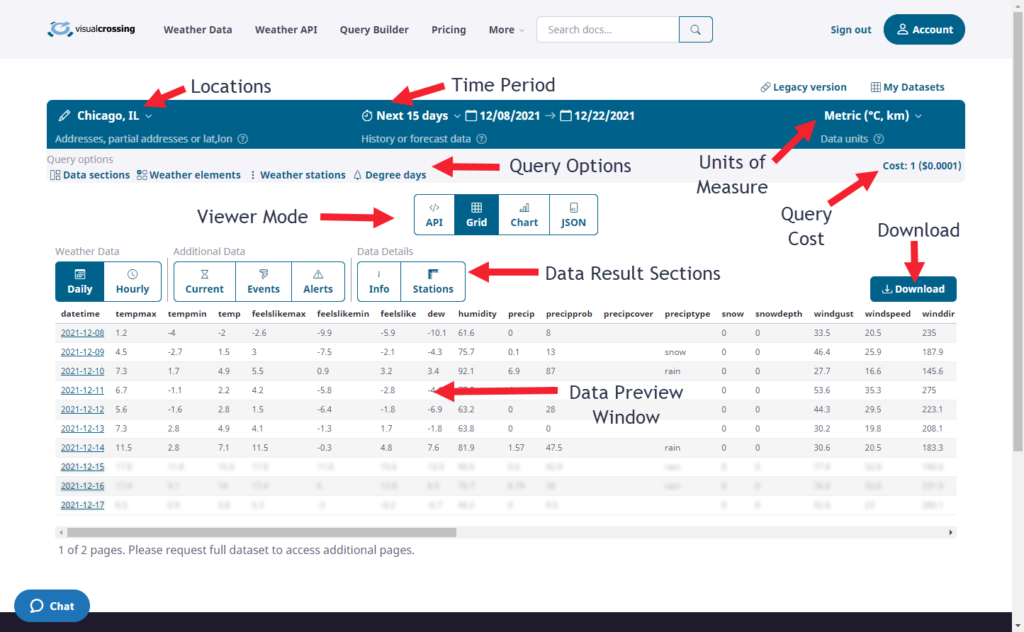
After entering the first location we can see the Query Builder results grid and how it has already been loaded with some forecast weather data. Here is a quick layout of the page for your reference:
Step 2 – Choose Your Forecast Time Period
The default query results shown in Query Builder is a forecast for the next 15 days. This is usually the best option when we want to analyze forecast data. However, we can easily change the data date range if we prefer
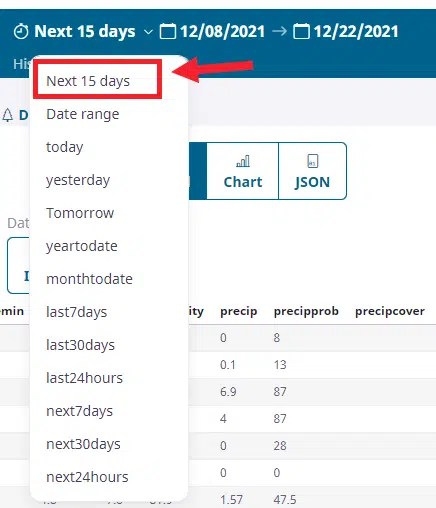
By keeping our date options as “Next 15 days” we are telling Query Builder that we want to see a full 15-day forecast for our given location. No other date selections are necessary. However, if we wanted only certain dates in the future we can choose “Date range” and manually select our own forecast start and end date. Alternately, we could use the Time Period control to select a dynamic period options such as “tomorrow,” “next7days,” or even “nextweekend.”
Step 3 – Preview Results & Download
As soon as we make a change to the query options, the grid automatically updates with a sample of the result data for our query. The default view is a grid containing daily data that looks like this.
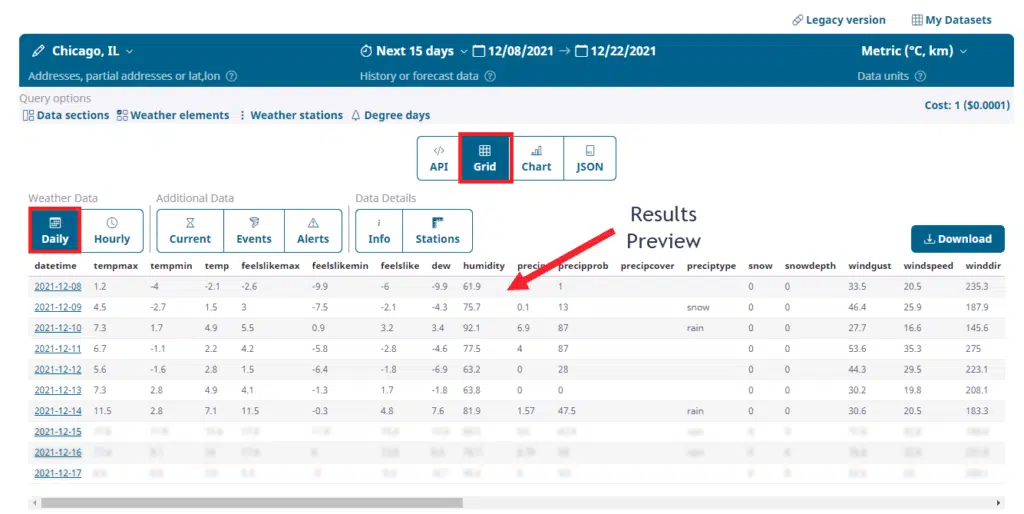
The Viewer Mode buttons allow you to see data other than the default daily view. You can use the toolbar to switch to view hourly data, current conditions, weather alerts, and more. For this example, we’ll use the most simple daily data, but once you have completely your initial analysis in Tableau, you will want to revisit the Query Builder view to explore its various options.
Step 4 – Download Your Result Data
We can now use Query Builder’s download option to download the data as a CSV file that we can import into nearly any analysis tool including as Tableau. Simply click on the Download button to start the wizard. Query Builder asks for the format type (we want to choose CSV), and we choose the Daily dataset that we saw above in the grid. Note that we could instead choose to download hourly data, alerts. or any of the other data sections available for our query.
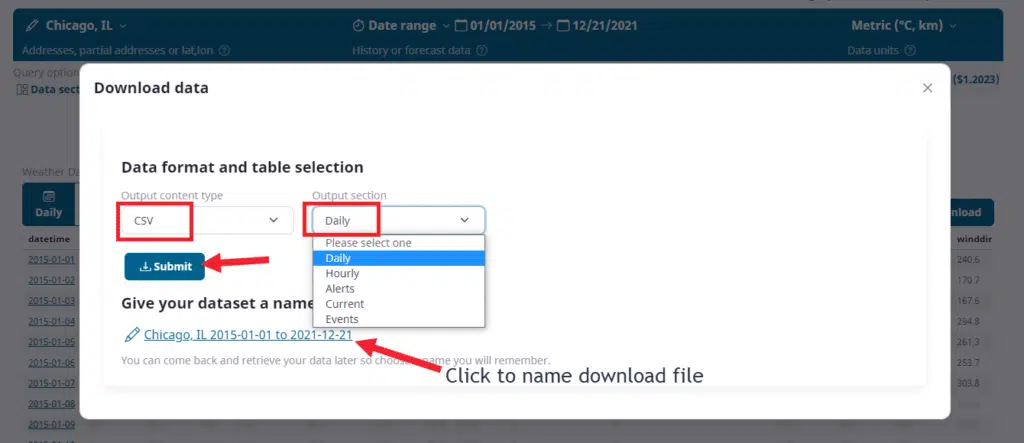
Now click the Submit button to submit the query and download the CSV result data file using the web browser.
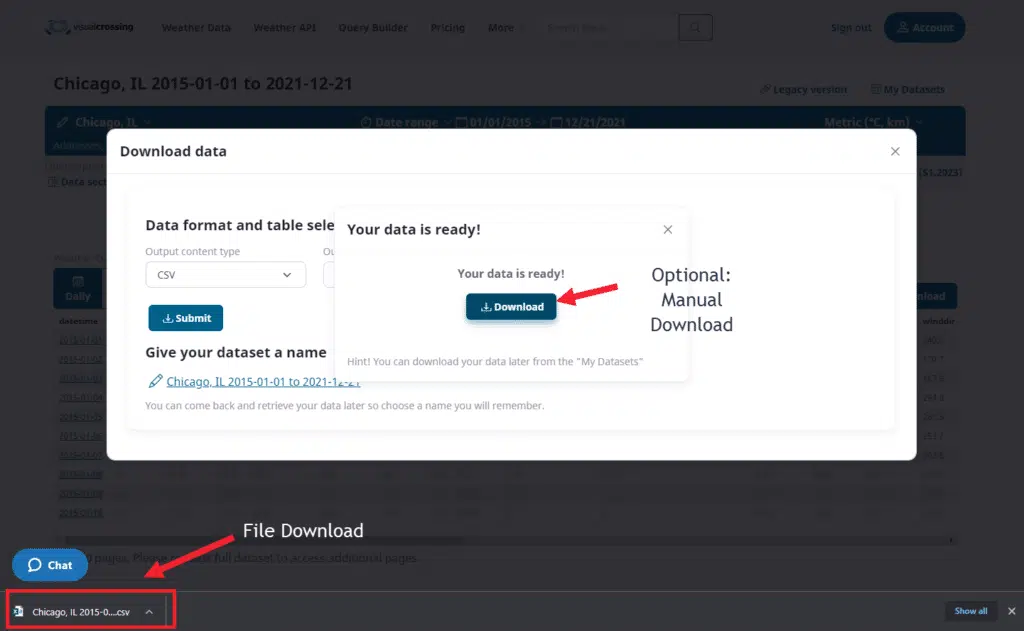
Depending upon your browser and system configuration, the file may download automatically or you may need to click an option to approve the download. In either case, you should now have a CSV file on your local disk.
Step 5 – Import the Weather Forecast Data into Tableau
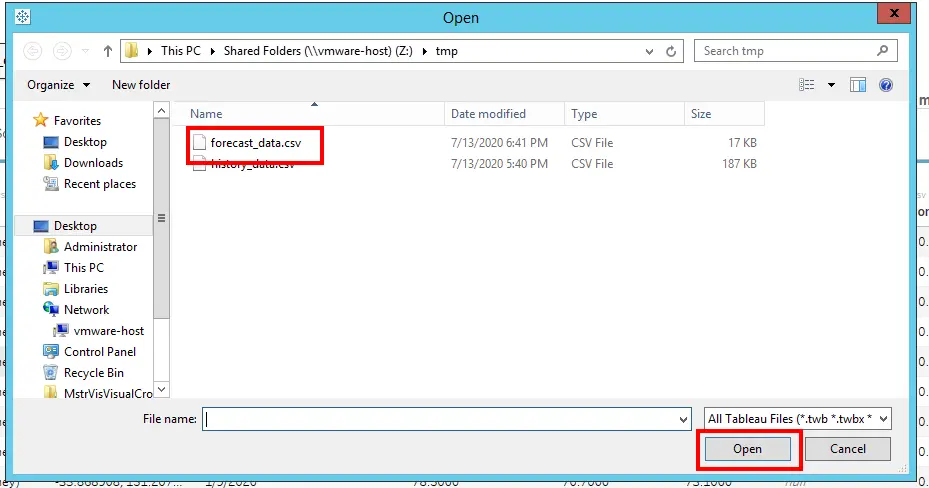
You next need to load the data file into Tableau. So choose the ‘Open…” option from the ‘File’ menu.
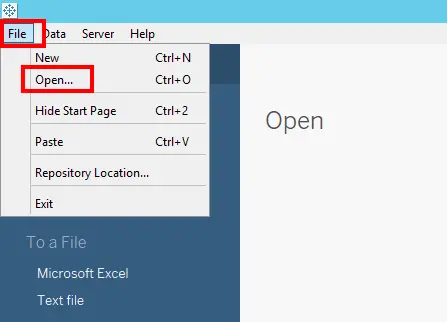
The file chooser will open and allow you to select the input data file for analysis. for this example, select the CSV file containing the forecast data downloaded in Step 6.
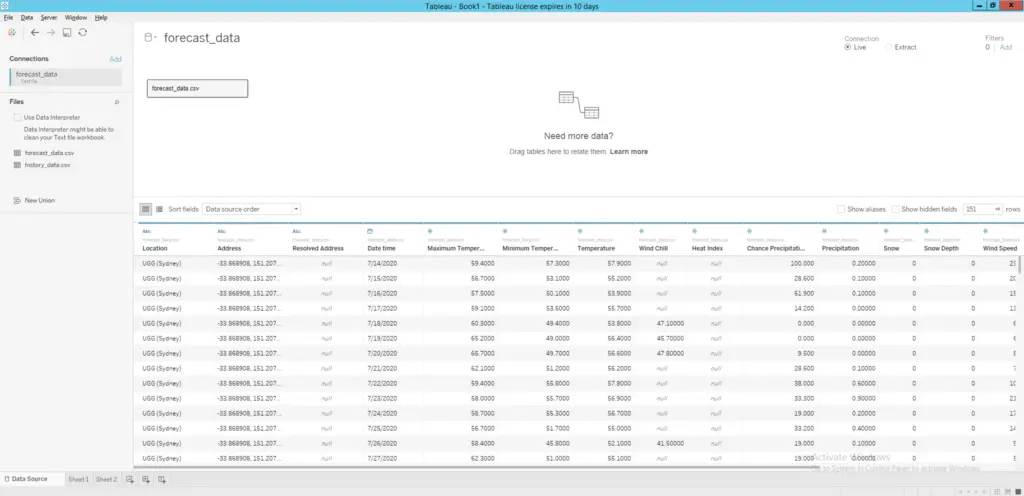
Step 6 – Configure the Weather Forecast Data
Tableau Desktop now displays the full data set containing forecast metrics for the next fifteen days. The metrics include common values such as temperature, precipitation, and wind as well as less common value such as heat index, cloud cover and wind gusts. For more information on the details regarding our weather metrics, please see our Weather Data Documentation.
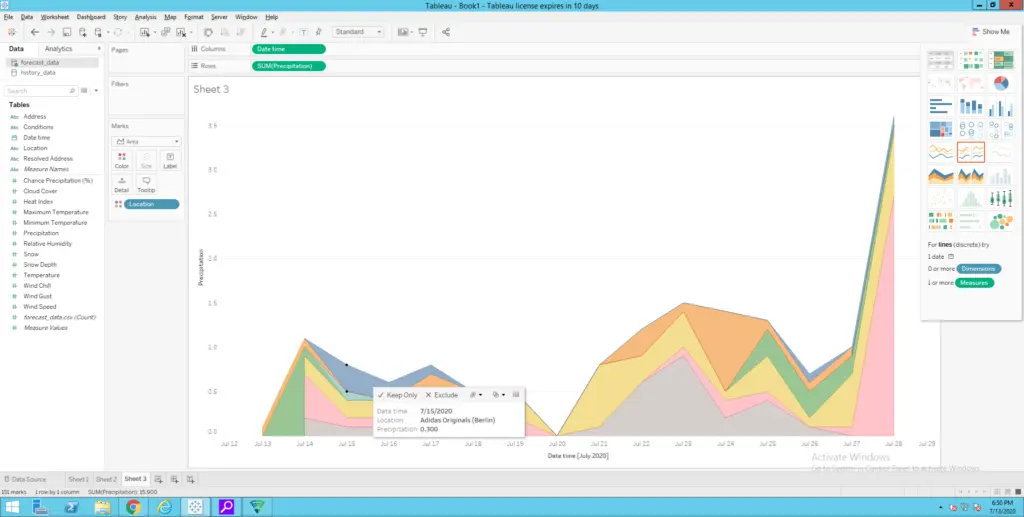
Step 7 – Create Your Weather Data Analysis
Now that the weather data is loaded into Tableau, you can begin your business analysis. You can bring all of the normal Tableau analysis tools to bear while you combine weather data and your existing business values. Like in the below example visualizing the tracking of rain events.
If you would like to learn more about using Visual Crossing Weather options such as history data, multiple location import, and use within other analysis tools please see our other tutorials.
Questions or need help?
If you have a question or need help, please post on our actively monitored forum for the fastest replies. You can also contact our Support Team.