Single API Call
A single API query returns historical weather data, current weather conditions, weather forecasts, and climate normals


From our free weather API for casual users to enterprise weather intelligence, users can access unified historical weather data, real-time data, and accurate forecasting in a single query.

Fast, low-latency responses make Visual Crossing a trusted resource across various industries that depend on immediate weather information, including logistics, manufacturing, and aviation.

We provide weather intelligence at scale in flexible data formats for seamless integration in any system. Query past, current, or future weather conditions in hyperlocal resolution.

Our weather database combines 50+ years of global observations along with current conditions, remote data, and detailed forecasts giving you one source for weather intelligence across the past, present, and future.
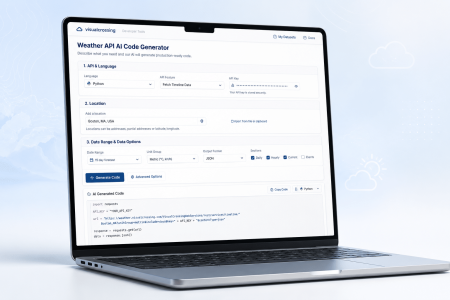
Our AI Code Builder takes the guesswork out of developing production-ready weather data API requests for any programming language or application. The Query Builder interface enables developers to craft precise queries for automated API calls, ensuring consistent access to high-resolution weather information.
Stop spending your development cycles digging through API documentation or searching message boards for the right syntax. Our AI Code Builder acts as an expert assistant, instantly generating ready-to-run scripts tailored to your specific project needs.
Whether you are working in Python, JavaScript, Java, R, or C#, the builder handles the heavy lifting of authentication, parameter formatting, and data parsing for you. Just define your location and weather metrics, and the tool outputs fully functional code that you can copy, paste, and deploy.
By eliminating the manual trial-and-error phase, the AI Coder lets you move from a concept to a live weather-integrated application in minutes rather than hours. It’s the fastest way to bridge the gap between our raw weather data and your production environment.
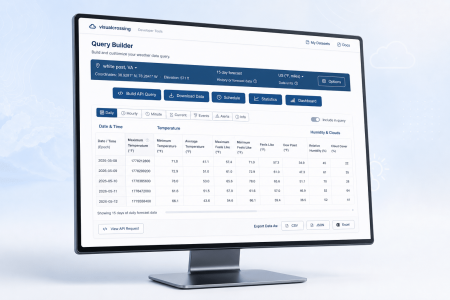
The Visual Crossing Query Builder is the ultimate “no-code” sandbox for structuring your weather data requests. Instead of guessing at API parameters or manual URL construction, you can use our intuitive interface to select your locations and desired weather results. You can toggle every available setting—from specific weather elements and timeframes to unit groups and data return formats—ensuring your request is exactly what your project requires.
One of the most powerful features of the Query Builder is the live preview, allowing you to see sample results instantly to confirm your data before a single line of code is written. This makes it an ideal collaboration tool: a product manager or data analyst can visually build and verify a query, then simply hand off the final, RESTful URL string to the development team for immediate integration. Whether you need a quick CSV export for Excel or a complex API-ready string for a production app, the Query Builder removes the guesswork from data retrieval.
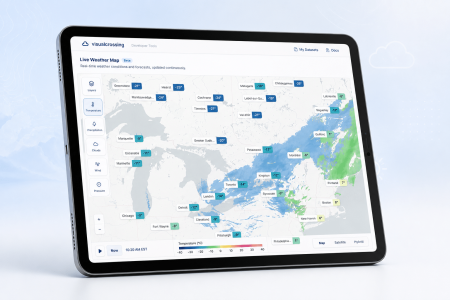
The Visual Crossing Live Weather Map is a high-performance, interactive demonstration of our Maps API, designed to show you exactly how weather layers can be integrated into your own mapping applications. Instead of just reading about capabilities, you can explore a free, live environment to see how our high-resolution map tiles render critical data like real-time precipitation, lightning strikes, and hail. It serves as a visual playground where you can toggle between various layers—such as temperature contours, wind speeds, and radar—to determine which elements provide the most value for your specific use case.
Beyond just a preview, the Live Weather Map helps bridge the gap between visualization and implementation. It allows you to experiment with different map styles and data legends, giving you a clear view of how our weather intelligence layers can be overlaid on standard mapping platforms like Google Maps, Leaflet, or Mapbox. Whether you are building a logistics dashboard to track severe weather or a local forecast app, this tool lets you visualize the possibilities and select the exact tile sets and legends you need before you ever start writing code.
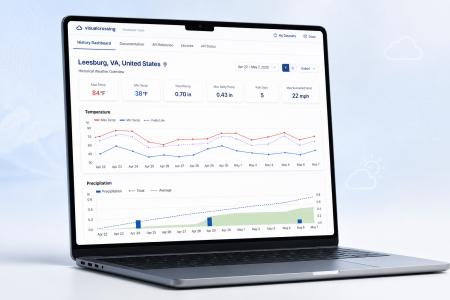
The Weather History Dashboard is the most accessible way to explore and verify historical weather data instantly. Whether you are a casual user or a developer, it provides a high-level summary of conditions for any location and date range dating back to 1970. By simply entering an address or a set of coordinates, the dashboard generates a suite of interactive graphs, charts, and maps that visualize exactly what the weather was like during your specified period. It’s an ideal “first stop” for confirming that your location strings or lat/long pairs map correctly to the right geographic area before you scale your data retrieval.
Beyond basic visualization, the dashboard serves as a critical validation tool. It allows you to confirm that the specific data points you require are available and accurate for your project’s needs. Once you’ve verified the data on the dashboard, a single click takes you directly to the Query Builder, where the underlying query is pre-populated and ready for you to customize or integrate into your code. Because the dashboard is built for transparency and sharing, you can easily send specific views to colleagues or clients via a direct URL that preserves the location and time range, making it a powerful resource for collaborative data analysis.
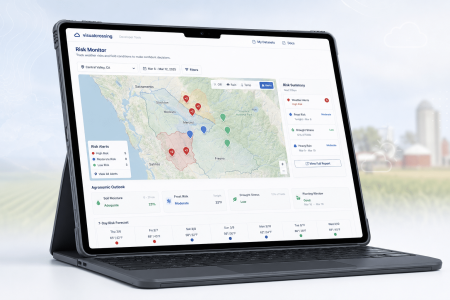
While the Weather Risk Monitor is a powerful end-user solution, it also serves as a high-value blueprint for developers looking to understand the full potential of our API. This tool demonstrates how complex weather data can be transformed into actionable operational intelligence without requiring the user to write a single line of code. For organizations that need immediate results, the risk monitor allows developers to provide a complete, “out-of-the-box” solution to internal teams—such as agronomists, field managers, or logistics coordinators—saving weeks of custom application development while delivering professional-grade monitoring capabilities.
The monitor is specifically designed to track high-stakes environmental variables, such as soil moisture, hyperlocal frost alerts, wind risks, and precipitation thresholds that directly impact yield and safety. Farmers and industrial operators use these specialized views to anticipate droughts, schedule critical harvests, and protect assets from extreme weather events. By utilizing the Weather Risk Monitor, your team can leverage pre-built visualizations and sophisticated risk-assessment logic that is already optimized for the Visual Crossing data engine, providing a clear path from raw weather metrics to real-world decision support.

Use weather measures such as temperature, precipitation, wind, humidity, UV Index, and more for all of you weather analysis needs.

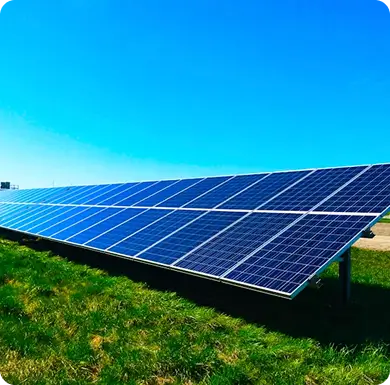
Understand how solar radiation conditions such as GHR, sun elevation, and diffuse radiation affect energy production from the sun.

Manage your agricultural activities using advanced elements such as soil temperature, soil moisture, and evapotranspiration.

Analyze wind speed and directions at heights from 10 meters to 100 meters for use in wind power projects and aviation.

Plan activities on the shore and at sea including surfing and shipping using wave height and swell conditions.

Monitor the air quality conditions in any location to see how they affect human health, livestock, or sensitive equipment.

Calculate how heating and cooling periods affect farm and garden planting, sowing, growing, harvesting, HVAC planning and more.

Track sunrise, sunset, phases of the moon, and more for use in planning outdoor activities such as hunting, fishing, and stargazing.

Receive severe weather alerts for impending storms, floods, and other important weather events.

Integrate weather data into your business by building an application or analyzing how weather correlates with existing data using nearly 100 advanced weather elements covering the entire globe.
Below are sample forecast and historical weather API queries that will work with our Timeline Weather API or Timeline LLX Weather API. To run these queries, simply insert your API Key into the URL and copy the query into any web browser or your own code. If you want to build your own queries interactively, visit our web-based query builder where you can customize your own query using our interface.
https://weather.visualcrossing.com/VisualCrossingWebServices/rest/services/timeline/London%2CUK?unitGroup=us&key=YOUR_API_KEY{
"queryCost": 1,
"latitude": 51.5064,
"longitude": -0.12719,
"resolvedAddress": "London, England, United Kingdom",
"address": "London,UK",
"timezone": "Europe/London",
"tzoffset": 1,
"days": [
{
"datetime": "2026-05-12",
"datetimeEpoch": 1778540400,
"tempmax": 59.9,
"tempmin": 40.6,
"temp": 50.7,
"feelslikemax": 59.9,
"feelslikemin": 37.5,
"feelslike": 49.8,
"dew": 36.5,
"humidity": 59.5,
"precip": 0.008,
"precipprob": 11,
"precipcover": 4.17,
"preciptype": [
"rain"
],
"snow": 0,
"snowdepth": 0,
"windgust": 24.4,
"windspeed": 11.9,
"winddir": 274.3,
"pressure": 1014.5,
"cloudcover": 48.1,
"visibility": 15.1,
"solarradiation": 239.1,
"solarenergy": 20.6,
"uvindex": 8,
"severerisk": 0,
"sunrise": "05:13:28",
"sunriseEpoch": 1778559208,
"sunset": "20:41:26",
"sunsetEpoch": 1778614886,
"moonphase": 0.86,
"conditions": "Partially cloudy",
"description": "Partly cloudy throughout the day.",
"icon": "partly-cloudy-day",
"stations": null,
"source": "fcst",
"hours": [
{
"datetime": "16:00:00",
"datetimeEpoch": 1778598000,
"temp": 58,
"feelslike": 58,
"humidity": 51.76,
"dew": 41.5,
"precip": 0.008,
"precipprob": 11,
"snow": 0,
"snowdepth": 0,
"preciptype": [
"rain"
],
"windgust": 24.2,
"windspeed": 11.7,
"winddir": 286,
"pressure": 1013,
"visibility": 14,
"cloudcover": 93,
"solarradiation": 220,
"solarenergy": 0.8,
"uvindex": 2,
"severerisk": 0,
"conditions": "Overcast",
"icon": "cloudy",
"stations": null,
"source": "fcst"
}
]
}
],
"alerts": []
}https://weather.visualcrossing.com/VisualCrossingWebServices/rest/services/timeline/New%2BYork%2BCity%2CNY%2CUSA/last7days?
unitGroup=metric&include=days&contentType=csv&key=YOUR_API_KEYname,datetime,tempmax,tempmin,temp,feelslikemax,feelslikemin,feelslike,dew,humidity,precip,precipprob,precipcover,preciptype,snow,snowdepth,windgust,windspeed,winddir,sealevelpressure,cloudcover,visibility,solarradiation,solarenergy,uvindex,severerisk,sunrise,sunset,moonphase,conditions,description,icon,stations
"New York, NY, United States",2026-05-01,17.7,8.1,12.6,17.7,5.4,12.2,2.1,50.6,0,0,0,,0,0,53.6,19,287,1011.6,27.3,16,314,27.2,10,0,2026-05-01T05:54:37,2026-05-01T19:52:25,0.5,Partially cloudy,Partly cloudy throughout the day.,partly-cloudy-day,"KEWR,KLGA,F1417,KNYC"
"New York, NY, United States",2026-05-02,15.8,9.9,12.9,15.8,9.9,12.9,2.5,52.6,0.603,100,8.33,rain,0,0,40.7,20.6,313.4,1011.1,89,15.8,204.2,17.7,10,0,2026-05-02T05:53:21,2026-05-02T19:53:27,0.53,"Rain, Partially cloudy",Partly cloudy throughout the day with morning rain.,rain,"KEWR,KLGA,F1417,KNYC"
"New York, NY, United States",2026-05-03,15.4,7.5,11.6,15.4,3.5,10.6,-3.9,35,0,0,0,,0,0,57.5,34.9,311.1,1011.1,68.9,16,254.5,21.9,10,0,2026-05-03T05:52:06,2026-05-03T19:54:29,0.56,Partially cloudy,Partly cloudy throughout the day.,partly-cloudy-day,"KEWR,KLGA,F1417,KNYC"
"New York, NY, United States",2026-05-04,21.9,10.5,16.3,21.9,10.5,16.3,2.2,39.7,0,0,0,,0,0,53.6,27.4,215.2,1011.7,9.8,16,316.7,27.3,10,0,2026-05-04T05:50:53,2026-05-04T19:55:31,0.6,Clear,Clear conditions throughout the day.,clear-day,"KEWR,KLGA,F1417,KNYC"
"New York, NY, United States",2026-05-05,26.2,14.5,20.5,26.2,14.5,20.5,9.6,51.1,0,0,0,,0,0,68.4,31,193.9,1009.6,21.2,16,303.5,26.3,9,10,2026-05-05T05:49:41,2026-05-05T19:56:33,0.63,Partially cloudy,Partly cloudy throughout the day.,partly-cloudy-day,"KEWR,KLGA,F1417,KNYC"
"New York, NY, United States",2026-05-06,21.1,14.2,18,21.1,14.2,18,13.5,76,6.1,100,20.83,rain,0,0,57.6,22.7,189.1,1008.7,64.7,14.5,78.8,6.9,3,0,2026-05-06T05:48:30,2026-05-06T19:57:34,0.66,"Rain, Partially cloudy",Partly cloudy throughout the day with rain.,rain,"KEWR,KLGA,F1417,KNYC"
"New York, NY, United States",2026-05-07,17.6,9.7,13.7,17.6,8.1,13.5,3.1,54.4,3.807,100,16.67,rain,0,0,42.5,17,329.4,1009.1,57.5,15.5,290,24.9,10,0,2026-05-07T05:47:21,2026-05-07T19:58:35,0.7,"Rain, Partially cloudy",Partly cloudy throughout the day with early morning rain.,rain,"KEWR,KLGA,F1417,KNYC"
"New York, NY, United States",2026-05-08,16.6,8.5,13.2,16.6,7,12.9,2.6,50,0.189,0,4.17,rain,0,0,47.1,24.1,304.7,1011.6,72.1,15.9,220.4,18.8,8,10,2026-05-08T05:46:13,2026-05-08T19:59:36,0.73,Partially cloudy,Partly cloudy throughout the day.,partly-cloudy-day,"KEWR,KLGA,F1417,KNYC"https://weather.visualcrossing.com/VisualCrossingWebServices/rest/services/timeline/Sydney,Australia/2026-04-01/2026-04-30?
unitGroup=metric&include=days&key=YOUR_API_KEY{
"queryCost": 30,
"latitude": -33.8696,
"longitude": 151.207,
"resolvedAddress": "Sydney, NSW 2000, Australia",
"address": "Sydney,Australia",
"timezone": "Australia/Sydney",
"tzoffset": 11,
"days": [
{
"datetime": "2026-04-01",
"datetimeEpoch": 1774962000,
"tempmax": 26,
"tempmin": 17.8,
"temp": 22.2,
"feelslikemax": 26,
"feelslikemin": 17.8,
"feelslike": 22.2,
"dew": 15.9,
"humidity": 69.1,
"precip": 1,
"precipprob": 0,
"precipcover": 16.67,
"preciptype": [
"rain"
],
"snow": 0,
"snowdepth": 0,
"windgust": 33.5,
"windspeed": 27.3,
"winddir": 29.3,
"pressure": 1022.7,
"cloudcover": 24,
"visibility": 10,
"solarradiation": 211.3,
"solarenergy": 18.4,
"uvindex": 8,
"sunrise": "07:07:01",
"sunriseEpoch": 1774987621,
"sunset": "18:50:53",
"sunsetEpoch": 1775029853,
"moonphase": 0.46,
"conditions": "Partially cloudy",
"description": "Partly cloudy throughout the day.",
"icon": "partly-cloudy-day",
"stations": [
"D5330",
"YSRI",
"YSSY"
],
"source": "obs"
}
]
}https://maps.visualcrossing.com/VisualCrossingWebServices/rest/api/v1/map/tile/preciprate/7/36/51.webp?key=YOUR_API_KEY&time=2026-05-11T20:00:00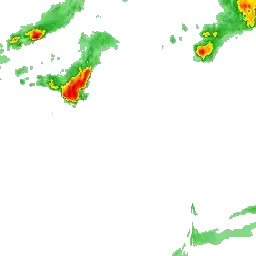
Accurate weather data doesn’t always come with a large price tag. That is why we offer pricing plans for everyone including free options to access the API. Our Metered plan is a pay-as-you-go plan that allows you the flexibility to use our weather data as you need it. For those that prefer monthly or annual subscriptions to the API we also offer a single-user Professional Plan, unlimited Corporate Plan and Enterprise Plans that are custom fit your demands for data size, concurrency or licensing terms. For more information, please see our full pricing information.
Visual Crossing Weather API requests are RESTful calls that can be made easily from any client or server. The API Key allows weather forecasts and history to be incorporated into any application, website or weather app in a matter of minutes. Simply follow our tutorials and sample code, and get started with entirely free access. Our weather data API allows 1000 completely free weather records per day.

RESTful APIs are ideal for integration in any programming language such as Java, Google Go, VB.NET C#, Python & Perl. Access the entire Visual Crossing Weather database including weather history data, accurate forecasts, air quality data, and real time conditions to make any application more powerful.
Results are available in standard, easy-to-consume data formats including JSON and CSV. Integrating the data into your own app or code project takes only minutes.
Use industry standard tools ranging from R and MATLAB to Excel and Power Query. Tutorials and how-to articles are available for these as well as other powerful analytics and business platforms. Whatever tools power your analysis, Visual Crossing’s Weather API integrates easily providing developers the best possible weather information.

Power BI is an interactive business intelligence tool designed to be simple enough for end users to create their own analyses while being powerful enough for enterprise-wide use. Weather data fits naturally into this analysis framework, and the Visual Crossing Weather makes the integration easy. Our query URLs can return CSV results that import directly into any Power BI report or dashboard.
High-end BI platforms represent the backbone of data analysis within many large and mid-sized companies. These powerful tools can crunch decades of business and external data to find patterns and make recommendations. By seamlessly integrating into BI environments, Visual Crossing Weather can be embedded directly into many business applications.

Google Sheets has become a universally accessible data analysis application due to the global reach of its web-based platform. That web platform powers instant data sharing in schools, companies, and around the world. Visual Crossing Weather data can be integrated easily into any Google Sheet application using a single API call.
An enterprise data warehouse is the heart of data science, machine learning, and business analytics for nearly every large and mid-sized corporation. The power to store vast amounts of business data enables analysts across an organization to work together to make intelligent business decisions. Visual Crossing Weather allows historical weather data, forecasts, and historical forecast data to be loaded into any database or data lake.
Many business activities are affected by weather. Adding weather data to an enterprise data warehouse brings new insight and more ROI from your existing investment.

Visual Crossing Weather API is the easiest-to-use and lowest-cost weather API available. Our single-call API provides unified access to historical weather data, current conditions, forecasts, and climate statistics. There is no need to learn multiple API endpoints or make multiple calls to get the data that you need. Our solution is the easiest in the industry providing both a RESTful API or integration into any code or script and our web-based Query Builder to compose queries interactively and download datasets. Whether your use case is adding weather data to application code or simply downloading weather records for analysis, Visual Crossing Weather is the best choice. And if you run into questions or problems, our support team is available to help. In addition, our prices start at free for both commercial and non-commercial use up to 1000 records per day, are only $0.0001 per record for pay-as-you-go access, and are even cheaper as part of a monthly or annual service plan.
However, don’t mistake easy and low cost for simple or cheap. Our rich data catalog provides access to nearly 100 weather elements for every location on the globe over the past fifty years and into the future. To make this accessible, our Weather Engine organizes and processes over one trillion weather records to ensure accurate, high-resolution weather answers to hundreds of millions of queries every day. Every minute, our Weather Engine loads updated conditions from around that world, and our weather database grows by gigabytes every hour to provide every query with the most accurate weather data possible.
Our passion is making the highest-quality weather data accessible to users around the world and helping people easily use that weather data to improve their applications, their decision making, and their lives. Try Visual Crossing Weather for free today and see why more businesses, developers, and analysts choose Visual Crossing.
Our weather API provides a range of specialized data for any industry or use case, all sourced from high-quality datasets and cleaned for immediate implementation. The AI Code Builder and desktop Query Builder are designed to simplify API implementation, ensuring a seamless experience for developers.
With the novel Timeline LLX Weather API, users can enjoy high-concurrency fast responses, crucial for lightweight mobile IoT apps. Choose between JSON, CSV, or FlatJSON for mobile application.


We offer comprehensive data for a range of use cases, which include:
You can specify a location using address, ZIP code, city name, or latitude/longitude.
Certain weather stations update every 15 to 30 minutes, while others update hourly. Visual Crossing uses interpolation to provide hyperlocal and regularly updated data to users.
Yes. Starting with our metered plans, users can access an unlimited number of records with unlimited concurrency. The Timeline LLX Weather API enables users to query 5,000 records per minute.
The Weather API allows you to request a date range or multiple dates in a single API using this format: /timeline/[location]/[date1]/[date2]
You can also use a dynamic date period to query for a given date range in relation to the current date.
Our Multiple Location Timeline Weather API allows users to query for multiple locations in the same request.
We have designed our API for ease of integration. Use the Query Builder to design and preview your API call, or use the AI Code Generator for the exact code needed for your application.
Yes, we offer free access to 1,000 records per day. If you require higher usage, our metered pricing enables you to pay as you go.
Many APIs are too simplistic for enterprise use, as they cover only basic data like weather and temperature. Others are too advanced for the typical consumer or business user, requiring complex integration and carefully formatted API requests.
Visual Crossing is different in that it is designed to support a range of applications and use cases, including both free and tiered access. The ease of integration allows business teams, academics, and developers alike to benefit from high-resolution, implementation-ready data from trusted government sources. Our product is scalable and affordable while also able to handle high request loads with low latency.