

What is the difference between historical weather data and forecast data for solar energy projects?
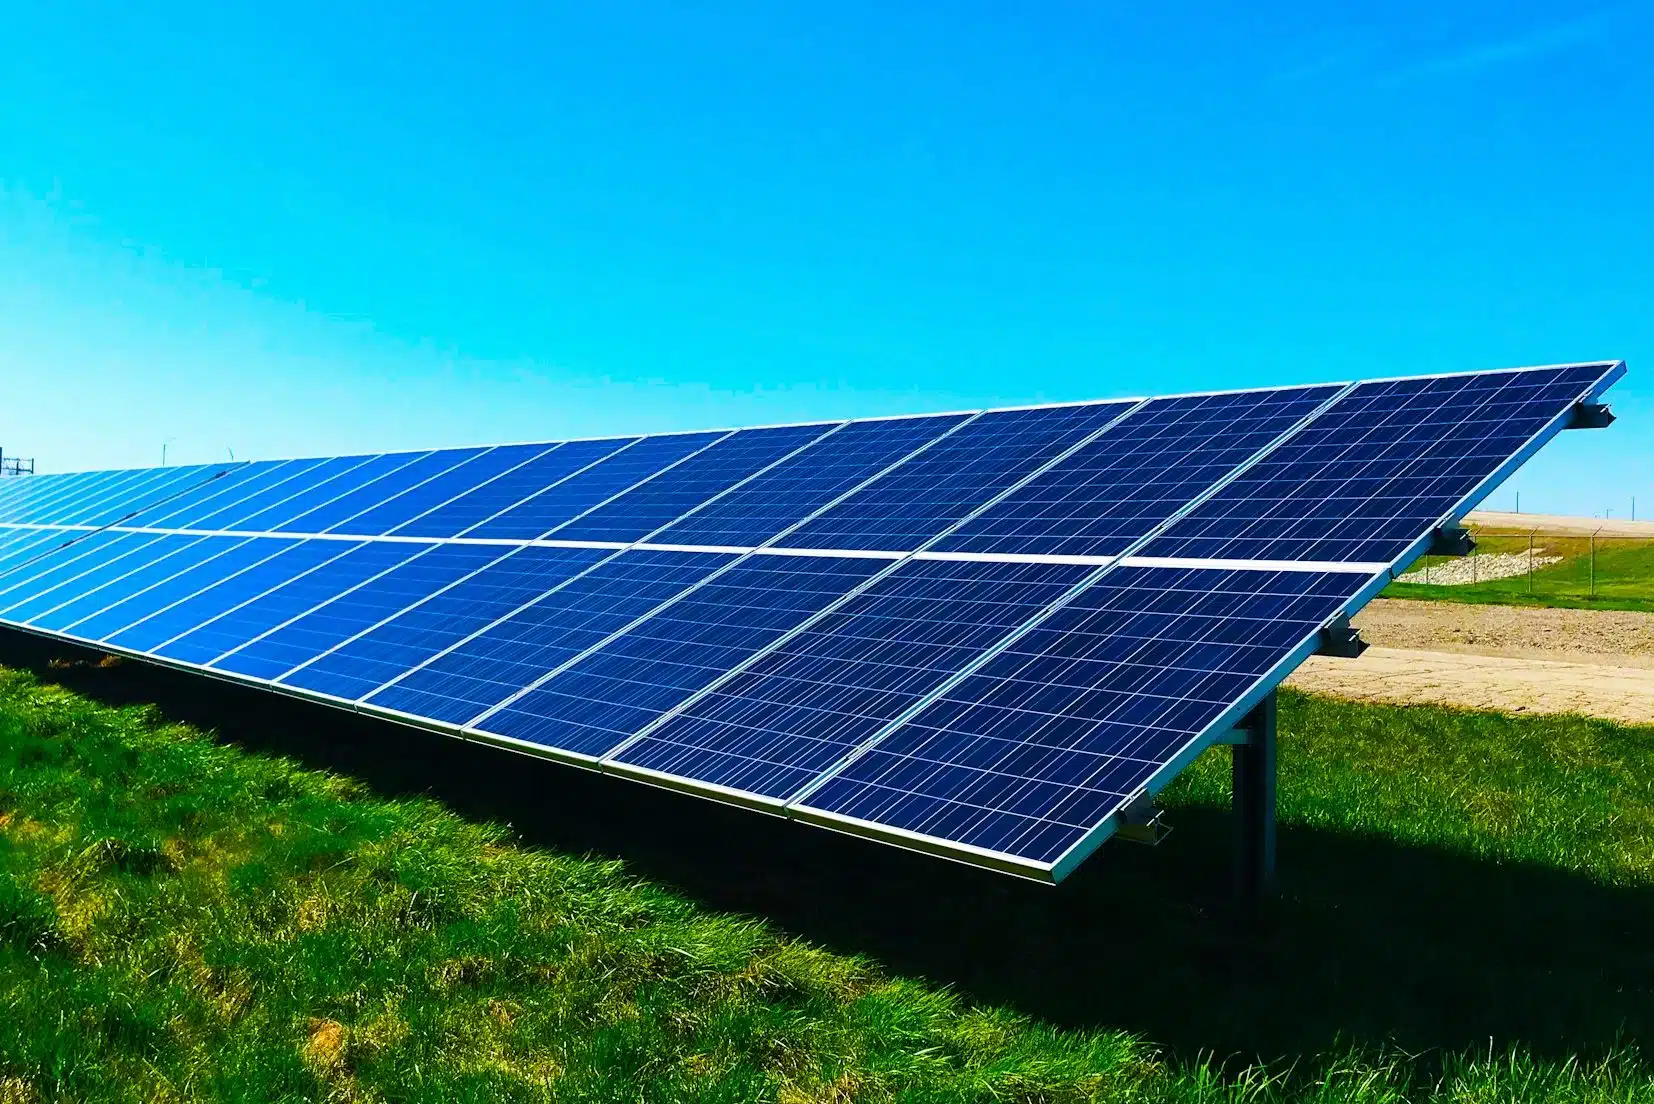
Weather Data for Solar Energy
Weather data for solar energy is crucial for all aspects of operational efficiency, including planning, construction, daily operations, and performance analysis. The Visual Crossing Weather API provides high-resolution global data for solar power applications, with easy integration via a single API key.
Available solar weather elements

Global Horizontal Irradiance (GHI)
Total amount of solar irradiation that hits a horizontal surface.

Direct Normal Irradiance (DNI)
Amount of solar irradiation directly that hits a surface placed perpendicular to the sun beam.

Diffuse Normal Irradiance (DIF)
Amount of indirect solar irradiation that hits a surface placed perpendicular to the sun beam.

Global Tilt Irradiance (GTI)
Total solar irradiation that hits a tilted surface, such as a solar panel.

Sun Elevation
The angle of the sun in the sky on the particular date and time.

Sun Azimuth
The compass direction of the sun used for solar tracker alignment and shadow analysis throughout the day.
Key weather api features for solar energy
Historical and forecast data
Historical reports from ground-based stations & satellites and forecasts from global & local computer models

CSV and JSON Results
Obtain rich JSON structures or easy-to-use CSV from any API call

Location address geocoding
Query data using our RESTful API or download data via our web-based Query Builder

Weather API or direct download
Query data using our RESTful API or download data via our web-based Query Builder for deploying crews or planning a grid management session.
Solve your business weather data challenges

Site Planning
Before selecting or upgrading a site, you need to understand the operational challenges and opportunities of this specific placement. Historical solar energy data is critical for energy yield predictions. However, regional data is often insufficient, so it’s essential to source downscaled or hyperlocal datasets.
Specific solar radiation data to consider include Global Horizontal Irradiance (GHI), Direct Normal Irradiance (DNI), Diffuse Normal Irradiance (DIF), and Global Tilted Irradiance (GTI).
General historical weather data is also key to estimating potential site-specific risks and benefits. For example, rapid temperature fluctuations can affect photovoltaic production, while heavy storms with strong winds may require protective measures or a dedicated repair budget. An air quality time series can also determine your cleaning schedules and maintenance needs.
Together, these datasets reduce uncertainty around site selection and future costs, making it easier to conceptualize, select, and approve a new solar farm. The Visual Crossing API easily integrates with commercial tools like Aurora, Helioscope, Scanfly, or homegrown applications.

Construction & Installation
Accurate weather data can reduce construction delays, improve worker efficiency, and manage site-specific risks. For example, extreme heat can endanger workers, while severe cold can delay concrete pouring for panel mounts because it will not set properly.
Windy, icy, and rainy conditions can stall rooftop work or electrical installations, adding days or weeks to the timeline. Historical wind and rain data will ensure that panel mounting configurations are adjusted for local conditions and are less susceptible to shifting.
Many construction projects already use Visual Crossing weather data, but the free Construction Weather Management Workbook for Microsoft Excel makes it even easier to apply weather-based solutions to common construction issues.
This simple tool enables users to schedule and adjust tasks based on key weather conditions such as temperature, wind speed, and precipitation. Visual Crossing’s reliable daily data collection eliminates the guesswork from asset management and scheduling for any construction project.
Production Operations
Solar installations are highly weather-dependent, and even minute shifts in solar irradiance or cloud cover can impact output. Real-time data enables you to make quick adjustments to panel angles or other parameters based on current conditions, ensuring peak production. Additionally, matching predicted energy availability to real output can help identify issues such as malfunctioning sensors or poor panel alignment.
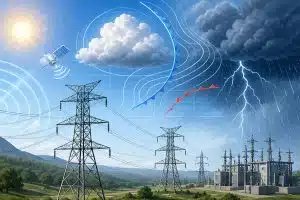
Weather forecast data is also key to grid stability and maintenance planning. If your region map shows several days of cloudy weather in a row, this would be a good time to perform routine maintenance while shifting more production to other outputs, such as wind farms. With high-quality meteorological data on rain, snow, and wind, you can assess whether panels may require preventive maintenance or additional protection.

Lifecycle Analytics
Solar production varies significantly throughout the year due to fluctuations in solar irradiance and sun angles. Historical comparisons can help predict seasonal demand and production changes, allowing you to schedule maintenance during low-demand periods.
By harmonizing output data with weather data, your team can assess how output varies with events such as cloud cover, storms, and heat waves. This can identify potential damage or performance changes from extreme weather events without needing to assess each individual panel.
Panels degrade over time due to environmental exposure, including air pollution, wind-driven particles, and high temperatures. However, what appears to be diminished photovoltaic output may be due to adverse weather or maintenance issues. Highly accurate weather data can help determine whether it’s time to replace your panels with newer models or if persistent cloud cover is mimicking decline.
If you’re interested in entering new markets, scaling your current operations, or offering more services to your existing user base, weather data is essential for making the right investment decision. Historical data can help you simulate expected yields hour by hour, including how small geographic deviations like a hill could influence solar irradiance and output.
When upgrading to newer models, you can use algorithms to compare specs with real-world conditions at that location, such as storms, heat waves, cloud cover, and air pollution. This ensures you make the best purchase for your budget and location.
Start today for free
Sign up for a free account now and immediately begin using our weather API to query accurate forecast & historical data for any global location.
In order to get access to our advanced solar energy measures, please sign up for a free account and then request a trial of the advanced solar elements.
FAQs about Weather Data for Solar Energy
Historical solar data explains the weather patterns that have occurred at a given location over time, helping inform investment decisions and site development. Forecast data helps operators predict output, schedule maintenance events, assess the accuracy of their tracking systems, and prepare for extreme weather events that may damage panels.
The most helpful solar data for energy yield modeling is Global Tilt Irradiance (GTI) and sun elevation. GTI measures the total solar irradiance incident on a tilted surface, such as a panel, and determines how much the panel can absorb.
Weather charts and visualizations can help predict energy yield based on factors like cloud cover, total average precipitation, and average solar irradiance. Even sites that are close together may have significant differences in the amount of solar radiation they receive due to elevation differences or coastal weather patterns.
Additionally, historical weather forecast data can assess the potential for damaging windstorms, thunderstorms, heavy snow, or high air pollution that may increase maintenance and repair costs. By considering these factors, you can decide between different sites or determine where to expand current operations.
Weather conditions determine the project’s current output. To ensure maximum productivity, operators must plan their maintenance schedules for low-output days, such as cloudy winter days.
Heavy windstorms or persistent air pollution can leave debris on panels, which reduces their output even when solar energy is high.
Unlike residential panels, which are typically fixed, commercial panels can tilt or pivot to follow the sun. To optimize output, commercial operators must identify the optimal panel angle for maximum yield, making metrics such as Global Tilt Irradiance (GTI) and sun elevation critical to production.