

Why retrieve individual forecast models?
Visual Crossing’s Weather API forecast combines information from multiple global, regional, and AI weather models into a single blended forecast. For most applications, this blended forecast is the recommended output.
In some cases, however, you may want to retrieve the forecast from an individual model. This can be useful when investigating an unexpected forecast value, comparing regional and global models, evaluating a new AI model, or creating your own model-selection or blending logic.
The V2 forecast pipeline allows you to retrieve individual forecast models through the same Timeline Weather API endpoint by specifying the forecastDataset parameter.
Comparing models with the Model Comparison tool
The Model Comparison tool provides a web interface for exploring individual models, blended forecasts, and forecast runs without constructing API requests manually.
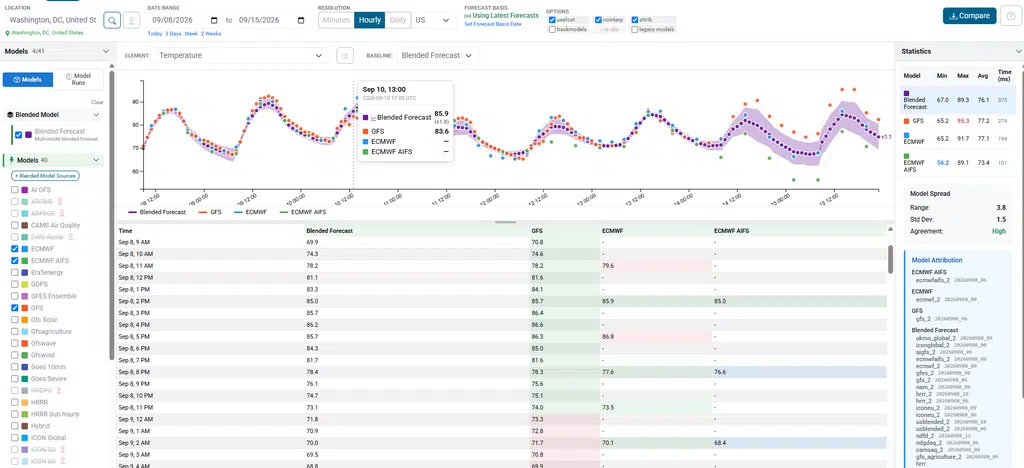
You can use the tool to:
- Select a location, date range, and resolution Choose any supported location and view forecast data at minutely, hourly, or daily resolution where available.
- Choose the forecast basis Use the latest available models for current forecast comparisons, or specify a historical forecast basis date and time to investigate forecasts that were available in the past. This is particularly useful for post-event analysis and forecast verification.
- Compare individual models Select multiple models and plot their forecasts together. Depending on the location and forecast period, available models may include GFS, ECMWF, ICON-EU, ICON-Global, HRRR, NAM, UK Met, AI forecast models, and other forecast datasets. Blended outputs such as the default V2 forecast can also be included in the comparison.
- Compare successive model runs Model Runs mode allows you to compare multiple runs of the same forecast model. This makes it possible to see how a model’s prediction for a particular time has changed as newer forecast runs have become available.
- Inspect native forecast intervals and attribution Options such as
nointerpolate, attribution, and model-change tracking can help identify whether apparent differences are caused by the source model, interpolation, model coverage, or changes in the models contributing to a blended forecast.
The Model Comparison tool can therefore be useful when investigating why models disagree, understanding how a forecast evolved over time, or identifying changes in the models contributing to a blended forecast.
Using the Forecast Model Comparison Tool
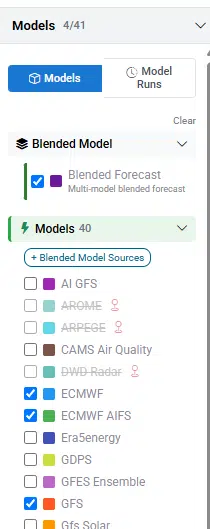
To use the Model Comparison Tool, select the location, date range, time resolution, and other forecast options at the top of the page. Then select the forecast models you want to compare from the panel on the left.
The Weather API returns the Blended Forecast by default. To compare individual forecast models with the standard Visual Crossing forecast, select Blended Forecast together with one or more individual models:
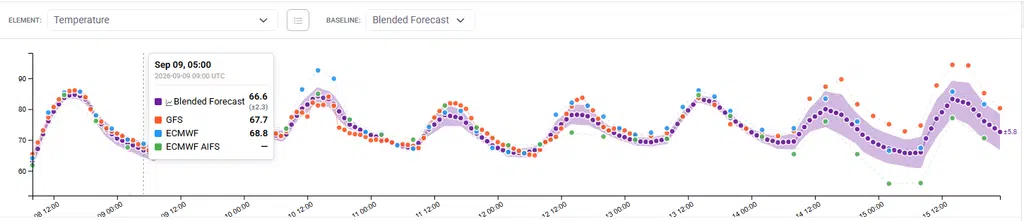
The results are displayed separately for each weather element, such as temperature, precipitation, wind speed, and pressure. This makes it easy to see where individual models agree or differ for a particular location and forecast period.
For some elements, such as temperature and pressure, the charts can also display forecast ranges derived from model and ensemble differences. These ranges provide an indication of forecast uncertainty. A narrow range generally indicates stronger agreement between the available forecasts, while a wider range indicates greater disagreement and therefore greater uncertainty for that time period.
Model availability and coverage
Individual forecast models may have limits on their geographic coverage, forecast range, time resolution, or available weather elements. For example, HRRR is a short-range regional model covering the United States, while the CAMS air-quality models provide air-quality elements rather than the full set of standard weather forecast elements.
When a selected model does not provide data for a particular location, forecast time, or weather element, the Model Comparison Tool displays a dash (-). The equivalent value in the Weather API response is null.
Missing values therefore do not necessarily indicate an error. They can simply mean that the selected forecast model does not cover that location, forecast period, or weather element.
Retrieving a single model forecast in the Weather API
Add the forecastDataset parameter to a normal Timeline Weather API request and specify the V2 model identifier. V2 model identifiers typically end in _2, for example:
gfs_2ecmwf_2iconeu_2iconglobal_2hrrr_2nam_2ukmo_global_2usblended_2
For example, the following request retrieves the ICON-EU forecast for London:
https://weather.visualcrossing.com/VisualCrossingWebServices/rest/services/timeline/london,uk?
unitGroup=metric
&include=hours
&forecastDataset=iconeu_2
&options=nointerpolate
&key=YOUR_API_KEY
When using the V2 forecast pipeline, use the V2 model identifier such as gfs_2, hrrr_2, or iconeu_2. These differ from the legacy model identifiers such as gfs, hrrr, and iconeu used with the original forecast pipeline.
Not every model is available for every location or forecast period. Regional models such as HRRR and ICON-EU only provide coverage within their supported geographic domains and forecast ranges. The Forecast Model Comparison Tool described below provides a dynamic list of currently available models. Not all models maybe available at the same time.
Useful forecast options
Several API options are useful when working with individual models.
forecastDataset=<model>_2
Selects an individual V2 forecast model instead of the default blended forecast.
options=nointerpolate
Returns the forecast at the model’s available forecast intervals rather than interpolating the output to hourly values.
This is useful when you want to see the forecast intervals provided by the source model. Some models provide hourly data for the early forecast period and then switch to three-hourly or six-hourly output farther into the forecast.
Without nointerpolate, Visual Crossing may interpolate these intervals to create a continuous hourly Timeline Weather API response.
options=attribution
Returns attribution information showing which forecast model or models contributed to the returned values.
This option is particularly useful when investigating the default blended forecast.
options=trackmodelchanges
Identifies changes in the contributing forecast model across the returned timeline. This can help show where the source contributing to a blended forecast changes as model coverage and forecast ranges vary.
forecastBasisDate=YYYY-MM-DD
Retrieves the forecast that was available at a specified historical date and time instead of using the latest available forecast.
For example, this can be used to answer questions such as:
- What did the forecast show three days before an event?
- How did different models predict the same storm?
- How did the forecast change as the event approached?
Historical forecast access requires the appropriate Historical Forecast API access.
How the default forecast uses multiple models
When you call the Timeline Weather API without specifying forecastDataset, Visual Crossing automatically selects and combines forecast information from multiple available models.
The models used depend on the requested location, forecast period, weather element, model coverage and availability, forecast resolution, and ongoing model performance. Regional, higher-resolution models are generally favored where they provide useful short-range coverage, while global models provide consistent coverage over longer forecast periods and in areas where regional models are unavailable.
Visual Crossing also applies forecast processing to produce a consistent hourly and daily timeline as individual source models update on their own schedules.
Because the default forecast automatically incorporates information from multiple forecast sources, it is normally the recommended option for production applications. Individual-model access is most useful when investigating or debugging a forecast, comparing and verifying models, evaluating new forecast sources, or building custom ensemble and model-selection logic.
For most applications, start with the default blended forecast and use individual models when you need to understand or control the underlying forecast sources in more detail.