






What is historical forecast data, and how is it different from historical weather data?
Historical Forecast Data
Historical forecast data helps users understand what customers, planners, systems, or investors were seeing in the weather forecast when decisions were made, which can be a key way to assess past organizational or consumer behavior. With the Visual Crossing Timeline Weather API, teams can go beyond global historical weather data to understand how weather predictions influenced short-term decision-making.

Analyse decisions based on the forecast people actually saw
Historical weather observations don’t always explain behavior, planning, bookings, scheduling, or operational choices. This is because of the “forecast effect,” in which operational decisions reflect predicted conditions more than actual outcomes.
By leveraging past weather forecasts, teams can understand why a given business or consumer decision made sense given the weather expectations, and then analyze outcomes against the forecast that informed the decision.
How historical forecast data supports real-world planning
By examining available daily data from specific dates, teams can understand how forecasts shape people’s decision-making processes, or the timeline in which they make decisions about short-term events. This information can be crucial to adapting business needs to expected forecasts. For example, if Monday’s forecast projects rain for weekend tee times, golf clubs can schedule fewer staff for the weekend, even if the forecast clears.

Hotel Reservations and Booking Decisions
Expected weather, such as snow depth, precipitation, or flood warnings, can determine whether guests book or cancel rooms. This data can provide hotels with insights into why a selected date was underbooked, even if the weather was fine.

Golf Tee Times and Outdoor Activity Planning
Golfers consider “feels like” conditions, temperature, and humidity when reserving tee times or other outdoor activities. Historical forecast services let organizations identify weather-related trends in bookings or attendance, which can improve future projections when expected conditions are similar to those of these slower times.

Retail and Demand Planning Before Severe Weather
Customers who receive snowstorm or extreme cold alerts from the National Weather Service or other trusted sources will stock up on necessities. Even if the snowfall doesn’t match predictions, this surge in specific purchases helps teams improve inventory management and marketing regardless of the actual conditions.

Staffing and Scheduling Based on Expected Conditions
While some businesses make monthly schedules that don’t consider weather conditions, more weather-dependent businesses typically adjust staffing and scheduling based on available forecasts. By comparing forecast-based decisions to actual outcomes, teams can determine whether these were reasonable and if any operational practices can be adjusted.

Weekend and Event Planning
The difference between the forecast and the actual weather can help teams decide how to build margins of error into their operations, such as faster responses to changing conditions.
Key weather API features for historical forecast data
Visual Crossing provides a comprehensive set of historical forecast data from trusted sources like NOAA’s National Centers for Environmental Information and the National Weather Service, with careful documentation and instructions so that any organization can benefit from records of 15-day forecasts.
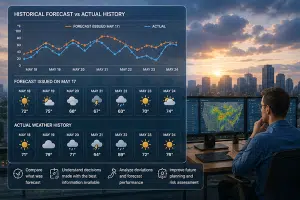
Historical and forecast data
Knowing both the forecast and the actual weather history can help users understand what information existed at the time when decisions were made. Visual Crossing enables teams to query a range of weather and climate data, including historical forecasts, to compare all the factors.
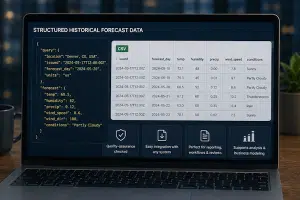
CSV and JSON Results
Our structured historical forecast data undergoes numerous quality-assurance checks to ensure accuracy. We provide these datasets in multiple formats for ease of integration, including CSV and JSON formats. This makes it easier to incorporate weather data into your reporting, operational review, data workflows, or business model analysis.
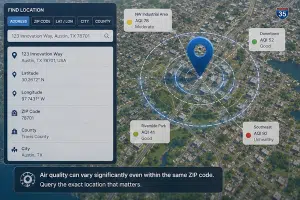
Location address geocoding
Decision analysis is tied to real-world locations, meaning you need records for these specific areas. With location-based retrieval, you can review the exact data that meets your needs. Flexible querying formats let you search by ZIP code, location address, or latitude/longitude values.
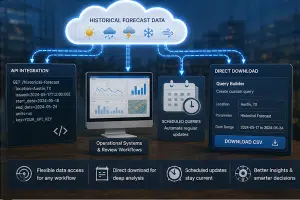
Weather API or direct download
Visual Crossing supports a range of workflows, from simple retrieval through a direct download to continuous integration with operational review processes. You can use the Weather Query Builder to build a query, then receive a link to a direct download for more advanced analysis. You can also schedule queries so that you receive fresh updates on a regular basis.
The Historical Forecast API lets you query any available records for immediate incorporation into an app, dashboard, reporting software, or other system.
How teams use historical forecast data
The “forecast effect” has a significant impact on daily operations for businesses in almost every industry, particularly those that work outside or respond to severe weather conditions. These are some of the ways that teams incorporate historical forecast records into their overall workflow.

Forecast Effect Analysis
Teams can leverage historical data to understand how forecasts influenced factors like sales, bookings, attendants, demand, or staffing. This lets users measure results based on what people expected to happen, not just what happened.
Decision-Time Reconstruction
Hourly forecast data helps users understand exactly what information was available to teams or consumers at each step in the process. This can be valuable for post-event reviews, showing how people adapted to changing conditions or whether they ignored potential risks.


Lead-Time Comparison
Comparing forecasts at different lead times for the same target date can offer a more complete perspective of how forecast confidence changed and how users adjusted their expectations. This can help explain why plans changed and what could have been done differently.
Operational Planning Review
Historical forecasts help organizations review their planning choices, including scheduling, resource allocation, routing for ground or air-based transit, or staffing. By creating a forecast timeline, teams can assess if earlier planning choices were reasonable or if they caused unnecessary stress later on.


Forecast Model and Performance Analysis
Forecast data is also valuable for deeper analytical work, including reviewing weather models, assessing how forecasts evolve over time, and evaluating forecast accuracy at different points in time.
Historical forecast analysis views
Visual Crossing enables users to explore a range of forecasts, ensuring that you have a complete understanding of what staff or customers saw at any given time.
Forecast Run Date
Run date shows what forecast was issued at a given time, which can explain what information was available during the decision-making process.
Target Date
For long-range forecasts, teams may want to assess the day that was being predicted in combination with the day the model was run.
Lead Time
Short-range forecasts are typically more accurate than longer-range predictions because of the many factors that influence weather. Exploring lead times can show how far in advance the forecast was made and which models were more accurate.
By Run View
Users interested in a full forward-looking forecast can see what was displayed to users on a given date.
By Target View
Target view helps users analyze how predictions for a single day changed over time, which can explain why operational decisions changed.
Forecast Change Over Time
By reviewing changes over time, users can evaluate expectation shifts and match them to planning signals.
Start today for free
Sign up for a free account now and immediately begin using our weather API to query accurate forecasts, historical data, and historical forecasts for any global location.
Historical forecast data helps reconstruct decision-time context and review outcomes with greater confidence, ensuring that you’re prepared when the forecast suggests similar conditions in the future.
FAQs about Historical Forecast Data
Unlike historical weather data, which shows actual measured conditions at a certain time, historical forecasts show the exact forecast that was available for a specific day up to two weeks before the actual weather on that day occurred.
Historical forecast data differs because it records forecasts from the past so that current planners can see the actual forecasts on the date when specific decisions were made. In contrast, current forecast data seeks to explain potential future conditions.
Yes, this is a common way to use past weather forecasts. This can explain decision-making processes even if real-world conditions didn’t match expectations.
Yes, Visual Crossing enables users to review forecast changes over time to understand how the information changed as the target date approached.
The Visual Crossing Timeline Weather API or the web-based Query Builder enables you to query for historical forecasts with a target date or period.