





How can weather data support wind energy site selection and resource assessment?
Weather Data for Wind Energy
The wind energy industry requires high-resolution site-level data to evaluate potential sites and measure wind farm performance. With weather data for wind energy, teams can plan, forecast, and prepare for adverse events to protect their assets.
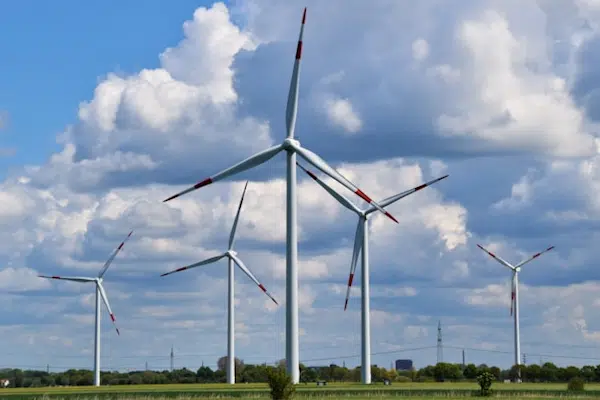
Turn wind weather data into better energy decisions
General forecasts do not provide the local, granular data that operators need to protect their operations. These weather overviews are meant for the general public and often do not include the specific conditions that affect individual wind turbines over time.
With specialized wind resource data, operators can plan site locations, predict wind power density, and quickly adjust to changing conditions that may threaten their assets. A consistent set of data from trustworthy resources ensures users don’t need to guess about wind performance at any point in time.
Available wind weather elements

Wind Speed at 50m
Knowing average wind speeds at a given site is essential for resource assessment and production planning, particularly at 50m above standard surface level.
Connect this to early-stage resource assessment, production planning, and evaluating wind conditions above standard surface level.

Wind Direction at 50m
Tracking wind direction at 50m provides a clearer understanding of local wind behavior and can determine the correct turbine orientation or angle.

Wind Speed at 80m
Wind speed at 80m is highly relevant for forecasting and performance analysis, as it is around hub height for the typical onshore wind turbine.
Wind Direction at 80m
Reviewing wind direction at hub height can help teams interpret turbine-relevant wind flow more accurately and adjust operations as needed.
Wind Speed at 100m
Offshore wind farms are typically taller, meaning these teams require data sets well above the standard forecasting height. High-quality data at 100m offers the hub-height insights necessary for rigorous production analysis.

Wind Direction at 100m
Data collection at 100m provides a precise interpretation of wind resource patterns where they matter most, ensuring accurate operational planning.
Key weather API features for wind energy
The Visual Crossing Weather API aggregates high-quality data from numerous national centers and government departments worldwide, including Met data, the US Department of Energy, the European Centre for Medium-Range Weather Forecasts, and the National Weather Service. This provides the spatial resolution researchers or operators need, whether they operate in the contiguous United States or across several countries worldwide.

Historical and forecast data
While minute-by-minute updates are crucial for daily operations, operators need quality time series for wind resource planning and performance analysis. Through understanding past wind patterns and future conditions, teams can make calculated decisions about site evaluation or energy forecasting. We offer over 50 years of data, cleaned and ready to analyze.

CSV and JSON Results
Our weather API provides several formats that can support a large number of different workflows. CSV is valuable for simple integration into operational planning tools or reporting workflows, while JSON offers the robust hierarchical structure necessary for deep engineering analysis.

Location address geocoding
While general forecasts provide overviews of large regions, location-address geocoding lets you see real-time conditions for specific wind sites, project areas, or locations under review for further development. This capability is crucial for project planning and site assessment, but also provides invaluable insights during daily operations.

Weather API or direct download
Teams can integrate the weather API directly into statistical analyses or interactive maps to access high-quality data at a glance. Downloading data is also simple, providing the robust datasets needed for long-term operational planning.
Solve your wind energy weather data challenges

Planning
A single turbine can cost hundreds of thousands of dollars, so teams need comprehensive data on average wind speeds, directions, and costs before making a final purchase decision.
Through our weather API, teams can evaluate the suitability of a given site using specific metrics and then compare wind conditions across several potential sites. This ensures the final investment decision isn’t based on a price tag and imagined potential, but on hard data.
Knowing the specific challenges of a site can also prevent costly missteps, like choosing the wrong turbine height or angling turbines toward dangerous shear winds. In certain areas, especially offshore wind farms, severe events like hurricanes or typhoons may cost operators thousands if not accounted for during site evaluation. Knowing historical extremes can help teams incorporate this into their contingency plans, ensuring everyone is ready to act when certain thresholds are crossed.
Construction
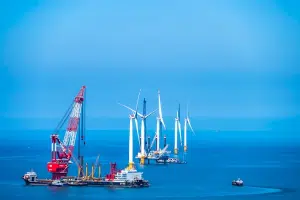
Wind and solar power sites are often in remote locations, meaning accurate weather data is essential to managing delivery risk and construction crew safety.
By assessing changing wind conditions, teams can schedule activities for safe windows. For example, they may delay setting up scaffolds and placing turbines until the wind is calm, as otherwise, crews may be placed in harm’s way. This reduces weather-driven disruptions and ensures that projects are delivered on time, without endangering human or technological assets.

Operations
Once a wind site is operational, weather data enables teams to plan day-to-day site activity. Operators can align performance expectations with actual or forecast conditions. During low-power days, grid planners can switch to other electricity generation methods and schedule planned maintenance, ensuring minimal disruption to consumers.
Turbines may be damaged by wind speeds or gusts above a certain threshold. With the Visual Crossing Weather API, operators can set parameters and receive advanced notice when conditions deteriorate, protecting these expensive assets without endangering the grid.
Analytics
When combined with other statistics, such as turbine sensor data, wind energy data helps operators get the most out of their assets. This data enables teams to review performance patterns and identify potential issues before the turbine fails. They can also refine their forecasting assumptions, such as recognizing that certain models do not align with more optimistic manufacturer projections, and adjust accordingly.
Lastly, weather data helps teams identify where sites or assets could be optimized, whether by adding new turbines or adjusting angles to capture more power.

Start today for free
Sign up for a free account now and immediately begin using our weather API to query accurate forecast & historical data for any global location.
Our wind energy data is invaluable for all aspects of wind generation, including resource assessment and optimization, production forecasting, lifecycle analysis, and operational planning. Visual Crossing’s API is easily integrated into planning dashboards, and teams can also bulk download data for more in-depth planning sessions as needed.
FAQs about Weather Data for Wind Energy
Wind resource maps can guide teams when choosing the right site. For example, two sites next to one another may have significantly different wind speeds due to complex terrain features. Once a site has been developed, teams can analyze the operational data collected against real-world conditions to assess efficiency, plan updates, or decommission nonfunctional turbines.
Wind weather data typically needs wind speed, gust, and direction at several heights. The most standard metrics are 50m, 80m, and 100m.
Wind data enables teams to predict generation capacity for a given day based on wind patterns at turbine height. This can be used to determine potential output in comparison to demand.
Understanding current and future weather conditions helps teams plan maintenance activities around times when wind power is likely to be low. Additionally, knowing the current and future wind resource power is critical for grid stability, as it ensures that teams can offload loads to other assets or protect their assets by shutting off turbines during wind storms.
As wind farms can cost hundreds of thousands of dollars, optimizing for peak performance is crucial to long-term profitability. Historical weather data is valuable for wind energy generation because it helps teams assess the wind resource potential at a given site, ensuring the site is suitable for development. Teams can consider the overall energy needs of the area and plan for grid stability before investing.
Using historical weather data, teams can also predict future conditions, estimate potential output, and measure site performance against these benchmarks. This can reveal potential issues, such as low-performing turbines with mechanical problems.
Certain areas, such as around coasts or high-altitude farms, are prone to high winds that may damage equipment. Factoring this into calculations through historical wind highs can ensure that teams choose turbines rated for these conditions while also developing contingency plans for the worst-case scenario.