







How can I access air quality data through an API?
Air Quality API
Visual Crossing’s Timeline Weather API provides high-quality air quality data for teams who need to track localized air pollution levels. Whether you are seeking to protect public health, safeguard your livestock from harmful air pollution, or maintain sensitive equipment, the Timeline Weather API provides real-time air quality insights.
A single API key unlocks both air data and specialized weather information, providing the full picture of weather conditions for a given location.
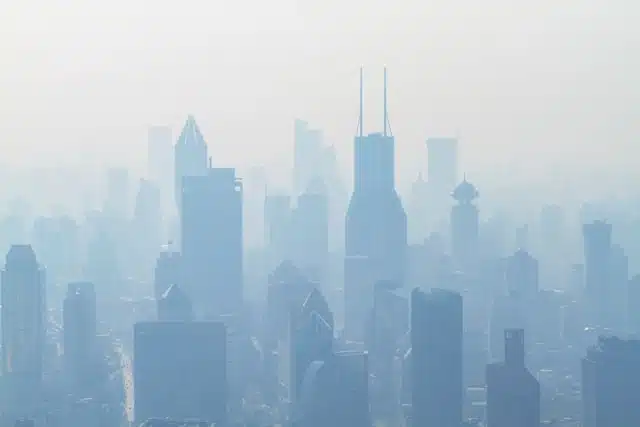
Turn air quality data into smarter monitoring and response decisions
While basic air-quality visibility may be helpful for the general public, it may not be sufficient for those who need to act quickly in response to changing conditions, including sensitive groups and environmental protection organizations. Visual Crossing’s air quality data, including AQI and pollutant-level visibility, is available for any geographic location with a single API response. This streamlined tool helps users respond quickly to changing variables and plan with confidence.
Available air quality elements

US Air Quality Index
The US EPA's air quality system provides a simple color-coded framework for understanding whether the air is unhealthy for specific groups. Its simple status codes make it easier to monitor overall conditions without complex data analysis.

European Air Quality Index
Like the US Air Quality Index, the European Air Quality Index provides clear thresholds for when the air is healthy for outdoor activities and also lists the dominant pollutant, such as O3 or CO2. These AQI values can be invaluable for international organizations that need real-time data from regional agencies. Data provided by the European Environmental Agency includes local time, primary pollutant, and station name.

PM1
PM1, the smallest form of particulate matter, is sometimes not included in AQI. Air quality indexes may instead place PM1 under PM2.5, but this microscopic pollution can be more hazardous to human health than larger forms of air pollution. Visual Crossing's air quality data offers more granular particulate monitoring, giving you deeper analysis than may be available from other APIs.

PM2.5
PM2.5, such as from wildfire smoke or industrial activities, is essential for health-sensitive monitoring. By incorporating this into your queries, you can make prudent operational choices based on current conditions, especially for those with heart conditions or asthma.

PM10
PM10 groups larger particulates that can impact visibility or endanger vulnerable groups, including those with lung conditions or the elderly. The Visual Crossing Timeline Weather API returns PM10 data to support event planning, public health announcements, logistics, and other weather-sensitive operations.

Ground-Level Ozone
Ground-level ozone data can be extremely hazardous to both human health and the environment, potentially defoliating crops or polluting groundwater. Ozone is often caused by industrial processes, so tracking it can be key to identifying non-compliant factory processes or assessing whether your operations meet key compliance metrics.

Nitrogen Dioxide
Nitrogen dioxide, like many pollutants, is caused by exhaust and industrial processes. It is also a precursor to ozone and PM2.5, both of which endanger human health. Teams can track nitrogen dioxide levels to limit fuel use on high-pollution days or determine which mitigation tactics work best for the local environment.

Sulphur Dioxide
Sulfur dioxide irritates the respiratory tract and can create sulfuric acid when mixed with precipitation, causing acid rain. This pollutant damages infrastructure, destroys crops, and endangers local water sources due to runoff. Our API allows you to return data on sulfur dioxide levels to perform sophisticated environmental analysis.

Carbon Monoxide
Carbon monoxide is caused by the incomplete combustion of fossil fuels. It is an odorless, tasteless, and colorless gas that can cause neurological symptoms or death if breathed in an enclosed space. Long-term carbon monoxide exposure can also cause nervous system damage, making CO monitoring a key consideration for operational awareness.
Key weather API features for air quality
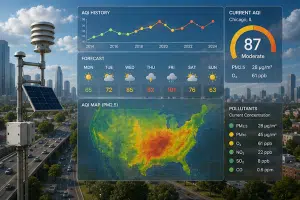
Historical and forecast data
The Visual Crossing API can connect you to available historical and forecast air quality data using the same query format as other weather data. The data obtained can then be used to review trends, adjust short-term plans, monitor thresholds, and make smarter decisions about worker health.
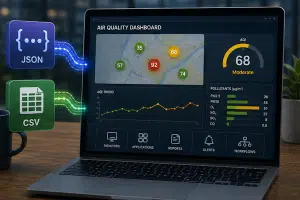
CSV and JSON Results
You can easily integrate air quality information into dashboards, monitors, applications, operational systems, or reporting workflows through structured CSV and JSON formats. This flexible data format makes it practical for any organization to use AQI data in their systems.
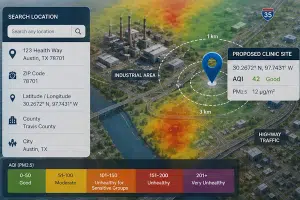
Location address geocoding
Air quality measurements can vary significantly even within the same ZIP code due to the presence of factories, geographic features, or highways. With the Timeline Weather API, users can query for specific coordinates, cities, or facilities. For example, teams could assess air quality issues at a potential health clinic site to ensure patients aren’t endangered by fine particulates.
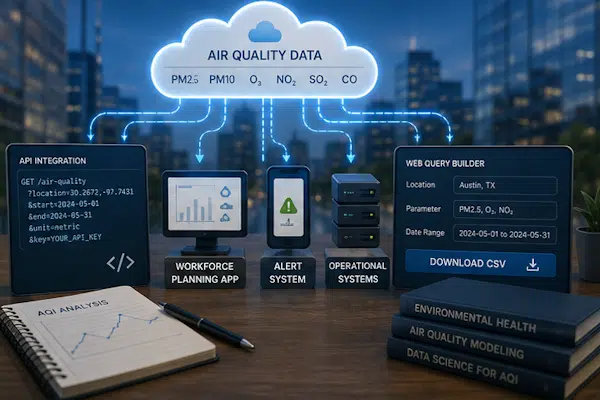
Weather API or direct download
Flexible data access enables organizations with any goal to incorporate air quality data into their operations. The weather API key can be incorporated into almost any system that allows API integration. For those who need to drill down into datasets, our Web Query Builder allows you to generate a custom dataset and download it for further analysis.
How teams use air quality data
Air quality impacts every business and individual, meaning that air quality data has a range of use cases. Visual Crossing’s Timeline Weather API can be used to monitor emerging pollution challenges, alert sensitive individuals to potential health hazards, or make data-driven operational decisions.

Historical Air Quality Analysis
Historical analysis helps teams understand how pollution has changed over time in a given area, such as considering the impact of a new industrial sector in a large urban environment. Pollution often has seasonal trends, so historical reviews can help organizations protect their workers or equipment before air quality deteriorates.
Air Quality Forecasting
Air quality forecasting enhances operational readiness and risk mitigation. Organizations can review forecasts to anticipate changing air quality conditions. As air pollution is mobile, large events elsewhere can have an outsized impact on local air quality, such as wildfire smoke from hundreds of miles away.
By checking forecasts, teams can make smart decisions such as limiting outdoor operations, adjusting schedules, moving events indoors, and preparing their HVAC systems for increased loads.


Air Quality Alerts and Notifications
The Visual Crossing API allows users to set alerts for available elements, which include air quality measures. Choose your element and parameters to receive alerts when the tracked element exceeds the threshold, such as PM1 above a certain level. This provides immediate communication when conditions change and enables faster interventions, like warning employees or sending out public safety alerts.
Location-Based Air Quality Monitoring
Air pollution is not static in any given location. It changes frequently based on current conditions, including temperature, cloud cover, precipitation, wind speed and direction, industrial activities, and car traffic. With location-based queries, teams can monitor conditions near them to better understand local AQI and pollutant-level changes. For organizations, this can be invaluable in protecting human health, while for scientists, it provides rich data to understand how pollution varies across different factors.


Sensitive Environment Monitoring
Certain environments require extra caution, including those with vulnerable populations, livestock, or sensitive equipment. Teams can use AQI and pollutant-level visibility to make critical decisions about risk levels or necessary interventions, such as bringing animals inside when particulate levels are too high or investing in air scrubbers for hospital environments.
Health and Operational Decision-Making
Even healthy individuals are vulnerable to air pollution, especially during high temperatures or with prolonged exposure. Air quality data helps organizations make safer, more informed decisions about daily operations that may impact human health. This includes air quality emergency planning, standardized communication about AQI risks, and response decisions when thresholds are exceeded.

Start today for free
Sign up for a free account now and immediately begin using our weather API to query accurate forecast and historical data for any global location.
With one unique API key, you can not only query weather forecasts or historical records, but also track AQI and analyze pollutants. Our API supports geographic requests by city, ZIP code, latitude and longitude, or other formats to provide location-specific operational awareness.
FAQs about Air Quality API
You can query air quality data via the API by creating an API call that includes your chosen metrics, such as the US AQI or PM2.5. This guide explains the available air quality elements in the Timeline API and how to query them.
Available air quality metrics include:
- United States Air Quality Index
- European Air Quality Index
- PM1
- PM2.5
- PM10
- Ground-level ozone (O3)
- Nitrogen Dioxide (NO2)
- Sulphur Dioxide (SO2)
- Carbon Monoxide (CO)
Yes, this is a common form of API usage. You can query for future dates at a given location using YYYY MM DD format. You can also set up alerts with your chosen parameters, such as PM2.5 levels above a given threshold or AQI values.
Air quality data helps organizations understand current conditions at a specific location, which can vary significantly depending on factors such as industrial activity, geography, microclimates, and transportation infrastructure. By understanding current risks, organizations can make responsible operational decisions, such as moving events indoors or shifting schedules to times when pollution is lower.
Yes, this is a common use case for air quality data. Pollution varies over time and is heavily influenced by local factors like chemical processing, power plants, motor vehicle traffic, population, and typical weather patterns. Different pollutants are often more prevalent at certain times of the year or may fluctuate hourly. By analyzing historical trends, organizations can predict the impact of poor air quality on human health and operations, thus enhancing their operational decision-making.