

Estimated reading time: 15 minutes
Weather conditions play a role in many of life’s events, both positive and negative. Hollywood has made a fortune with scenes showing lovers frolicking playfully in a surprise rainstorm and heroes battling the elements to save the day, umbrellas optional.
And who doesn’t fondly remember a beach trip sitting on a lounge chair, warm sand between your toes, watching soft white clouds drift endlessly through an azure sky, hoping that the day would never end.
However, weather events can have a darker side as well.
Strong thunderstorms and hurricanes cause floodwater to fill basements, ruin houses, and even wash away entire towns. High winds and tornadoes down trees, peel off roofs, and on rare occasions cut a path hundreds of miles long, taking hundreds of lives in the process.
Hail can damage roofs, home siding, and cars. Snow and ice can cause traffic accidents ranging from fender-benders to fatalities. Even relatively common extremes of heat and cold can damage crops, break pipes, and cause injuries related to outdoor activity.
All of these can spawn insurance claims.

In this article, we will discuss various categories of weather data that can be used to support insurance claims and how you can use a weather data system such as Visual Crossing Weather to find powerful, factual data to bolster your case.
Flooding
While typical homeowner’s insurance does not cover flood damage, it has been said that the National Flood Insurance program is the best insurance value in America.
But no matter what type of flood insurance you have, if you are preparing a flood insurance claim, it is important to know how much rain has fallen or how much snow is available to melt in your area to produce flood-level water.
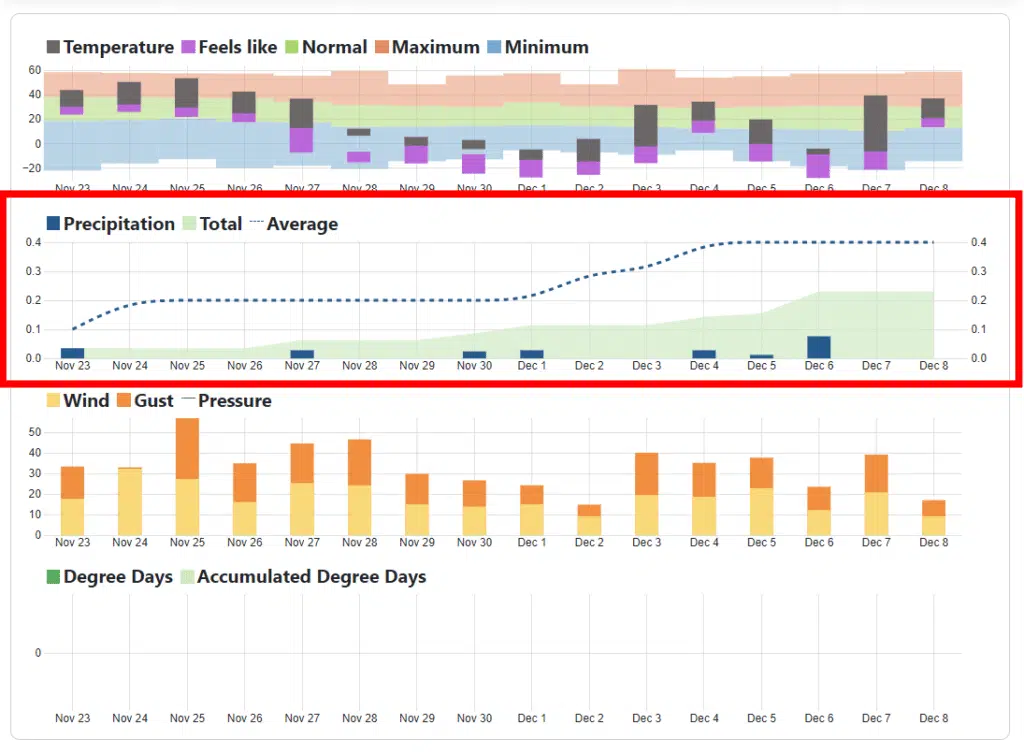
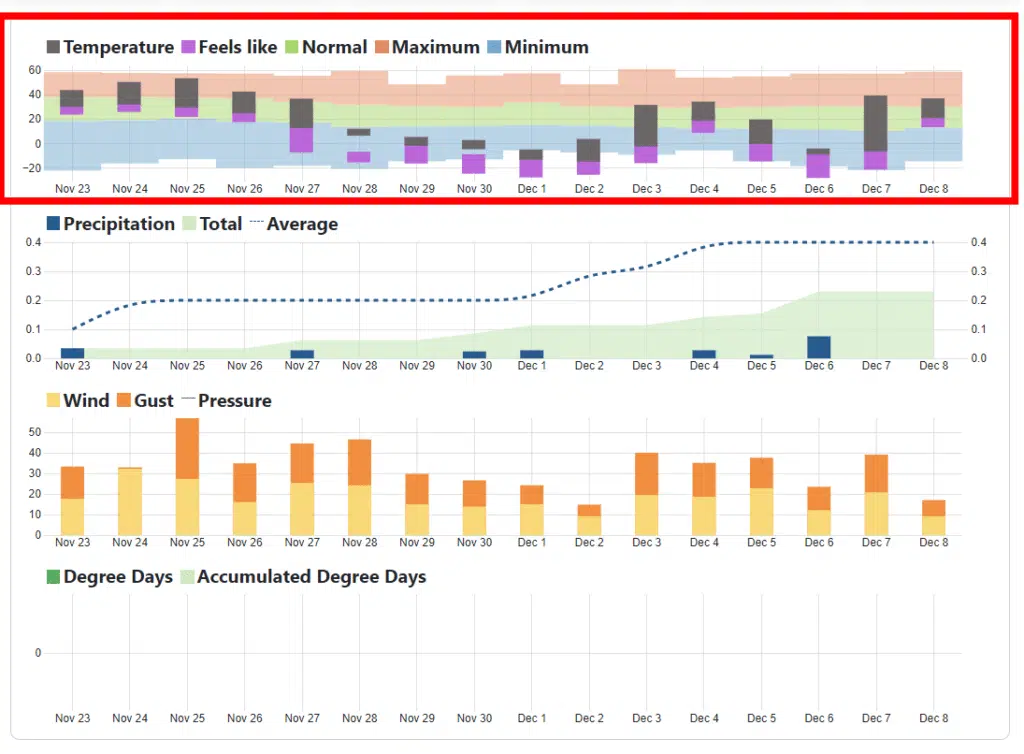
In the case of rain, we can use the Visual Crossing Weather History Dashboard to easily see the amount of rain that has fallen in any area over a period of time.
Simply enter your location and select your desired date range.
The middle graph in the middle of the page will show the precipitation on every day in the range individually, as well as the accumulation over the entire period. In the case of a flooding event caused by rain, you should be able to see a significant spike on one or more days that triggered your loss.
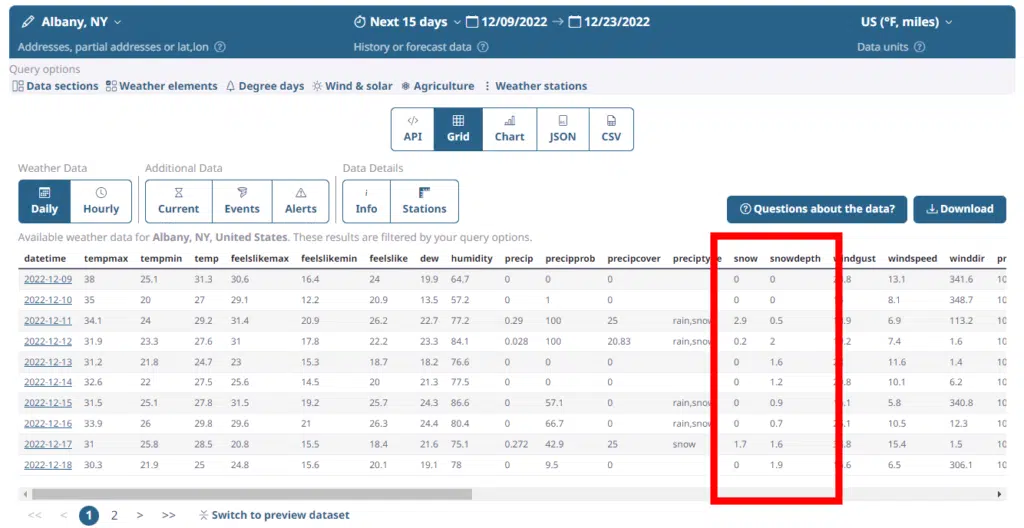
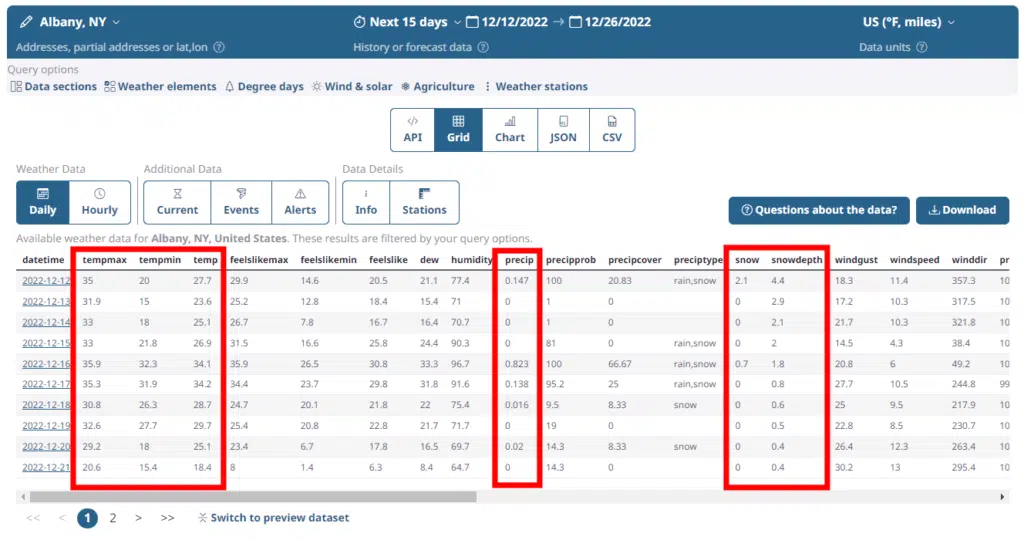
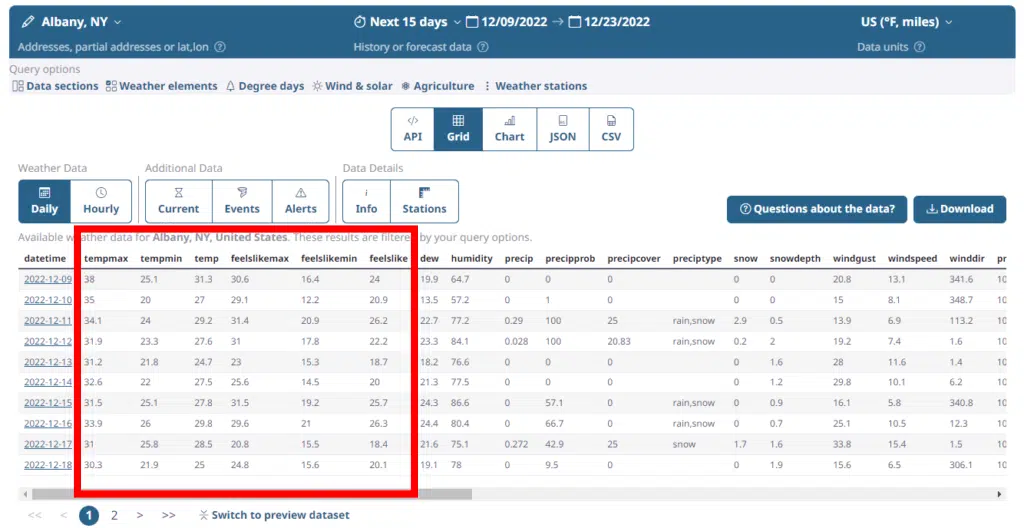
While snow data is not directly shown on the Weather History dashboard, its equivalent in the form of liquid precipitation is. However, if you want to know more about snow specifically, you can use the web-based Query Builder to run custom, historical weather queries. It is very similar to the Weather History dashboard.
Simply enter your location and date range. However, instead of graphs, you will see a grid of data. On this grid, you can easily find snow events and see snow levels accumulated on the ground using the snow and snowdepth columns.
When you see a sudden drop in snow depth, typically correlated to a temperature rise, flooding may be a result. This data can be easily exported as a CSV file for further analysis in a tool such as Excel or for direct inclusion with your insurance claim.
It is important to note that flood waters that affect your home can often originate from rainfall or snow melt well upstream from your location. In those cases, you will want to use the techniques above to look at precipitation data upstream.
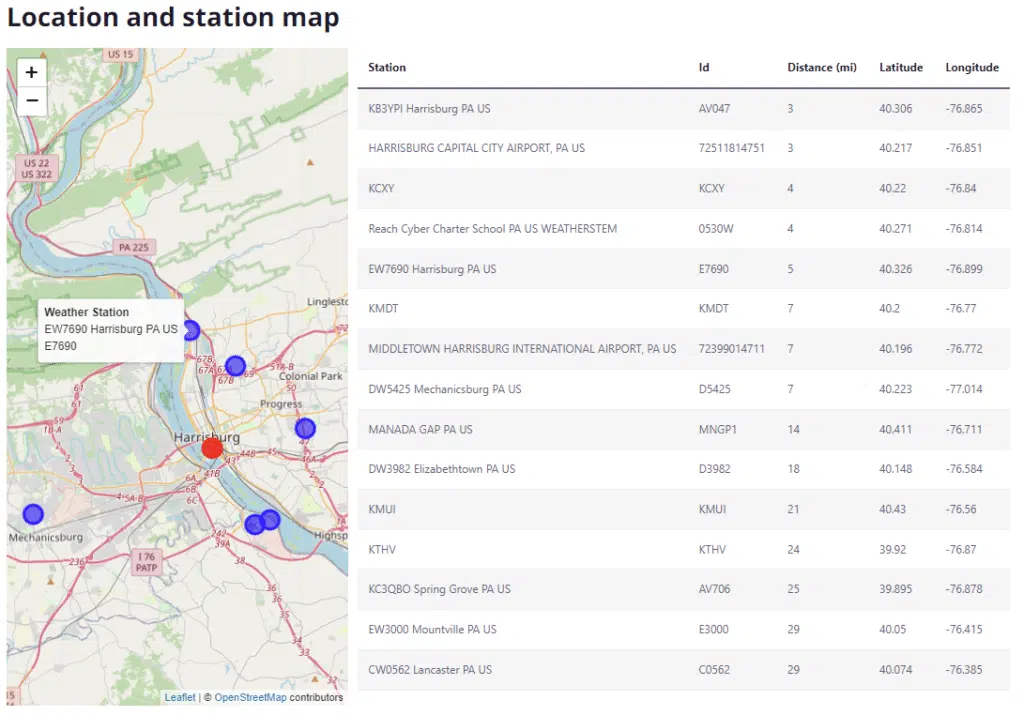
Luckily, the Weather History dashboard makes it easy to find locations and weather stations in your general area. The map at the bottom of the dashboard will help you find your local waterways and weather stations along them. Simply mouse over any blue weather station to get the unique station ID.
You can then query weather data from this specific station using the format “stn:XXXX” (without the quotes), where XXXX is the ID of the station. The convenient station table to the right of the map offers an easy way to copy and paste IDs.
Wind Damage
Wind is another common event that causes weather-related damage for homeowners and businesses alike. Luckily, wind events are easy to track using the same methods described above for rain.
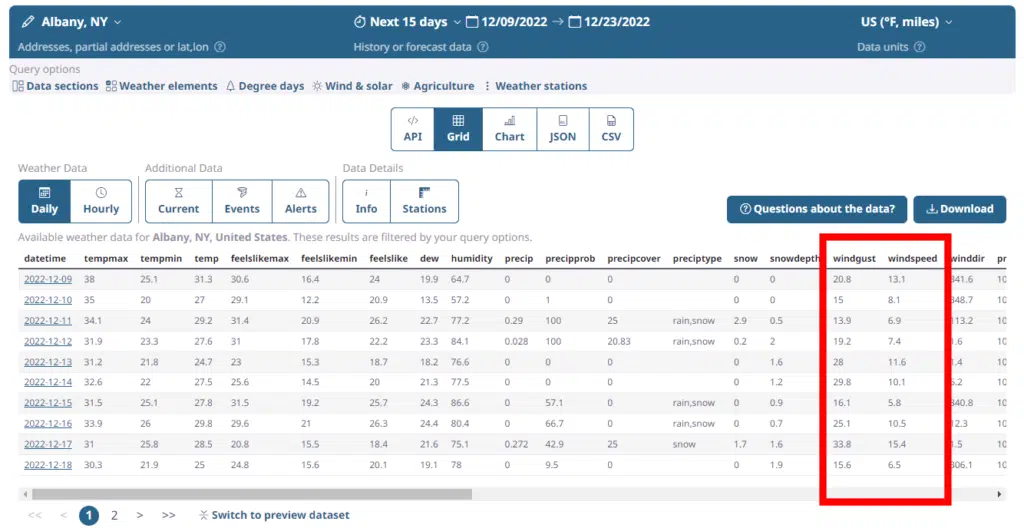
When it comes to wind-specific events, you will want to watch two weather elements, wind and gust. While the wind element is the average sustained wind speed leading up to the observation time, gusts are defined as events in which the wind blows at least 10 knots (11mph or 18 km/h) greater than the average wind speed.
If there are no gusts that meet these criteria, the gust value is not reported at all. This fact often confuses people. However, the lack of reported gust data should not be taken to mean that there were no strong winds.
While most weather events that include damaging winds do record strong gusts, you should always consider the average wind value as well. In certain events, such as hurricanes, strong, sustained winds can cause enormous damage.
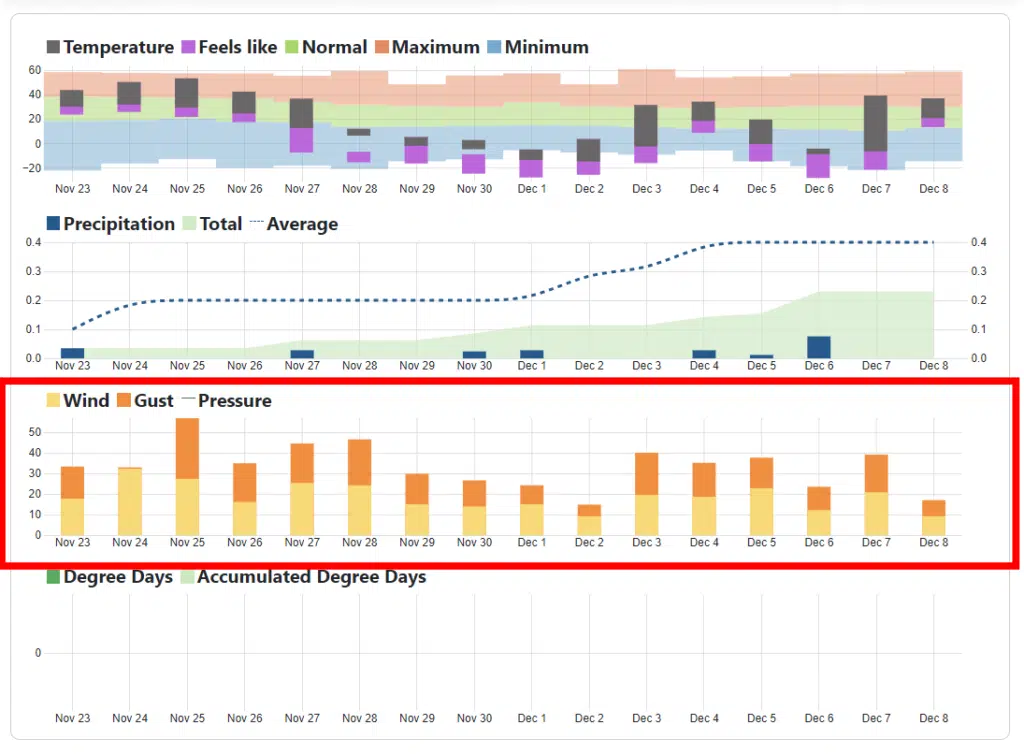
As explained in the flooding section above, you can use the Weather History dashboard to do basic wind tracking. Simply look at the wind graph in the middle section. In the example shown below, you can see days with average wind speed in the 20-25 mph range. That is unlikely to cause much damage.
However, on some days, you can see that there were gusts exceeding 50 mph. In a more serious windstorm situation, you will be able to see exactly how strong the wind was on any specific day.
However, sometimes in the case of wind and gusts, you will want to look at the hourly level or even the sub-hourly level to make sure that you don’t miss spikes that can get lost in daily data.
To do this, we can again use the web-based Query Builder that we used above to examine more detailed data. In the example below, we can see the weather data hour by hour.
By its nature, even hourly data might miss some of the strongest winds if they only occur for a short time. In order to get the highest-resolution data possible, we may want to access the raw, sub-hourly weather records as they come from the weather stations themselves.
Since using sub-hourly data can be a bit more complex and has important limitations, a detailed discussion of sub-hourly queries is outside the scope of this article. However, you can read more about how to access this data in our detailed sub-hourly tutorial.
For the purposes of this article, just be aware that the sub-hourly data is available via the Visual Crossing Weather service, and may help you to find the best possible wind data where short timeframes are important.
Event-specific Damage Including Hail and Earthquakes
Events such as hail, fallen trees, and even earthquakes are reported via weather event data. These can be queried via the Query Builder in the same way that precipitation and wind are queried.
To find weather events for a specific location and period, run your weather query in Query Builder as normal. Then, in the results area, click on the Events toolbar button. You will see a table of events recorded for the time period that you selected.
You will typically see events such as fallen trees and power line issues reported to police, along with hail or other exceptional conditions reported to officials.
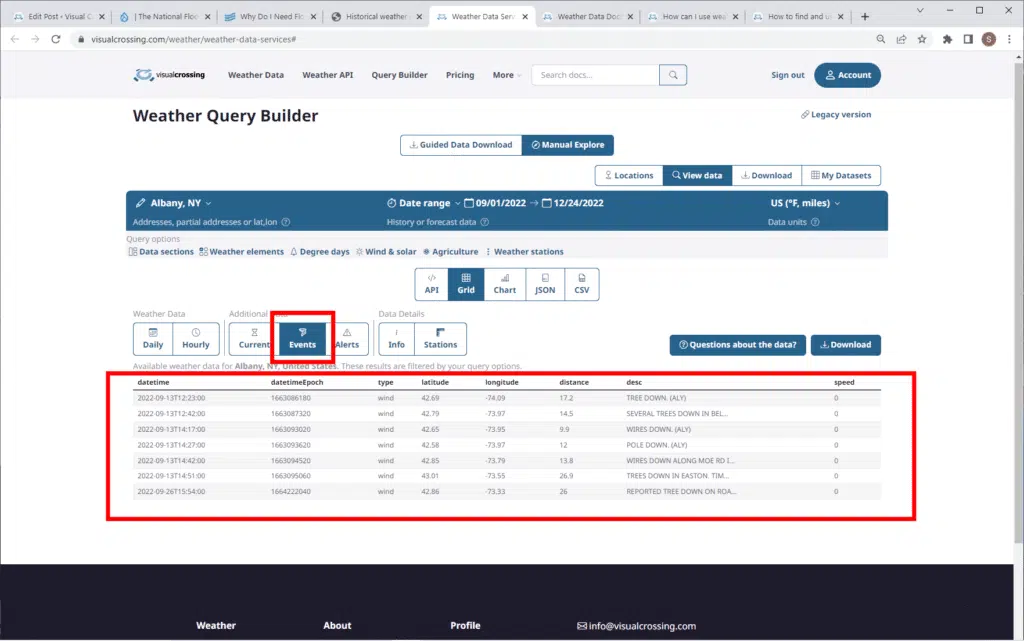
It is important to note that not all events are reported and logged into the weather database. Certain storms cause more logging than others, and the conditions in which even are logged may be counterintuitive at times. Small and more localized events tend to be reported more thoroughly than major, area-wide storms.
For example, in some cases, a major hurricane making landfall may produce few or even no events. This is apparently due to first responders and the few remaining residents not taking the effort to report hundreds of individual events.
All of the issues are dealt with as part of the overall storm cleanup. However, later, when the hurricane is less potent and causing smaller events in other areas, those are more likely to be reported and recorded as logged events.
For more information on the types of events that are reported and how to query them, see our article on the specific topic of events.
Snow and Ice
Snow and ice often cause issues when travelling and in other mobile situations. They can lead to car accidents, snowmobile mishaps, and even falls while walking. All of which result in insurance claims.
While snowfall and snow-on-the-ground data can be found using the Query Builder as described in the flooding section above, icing issues can be more difficult to identify.
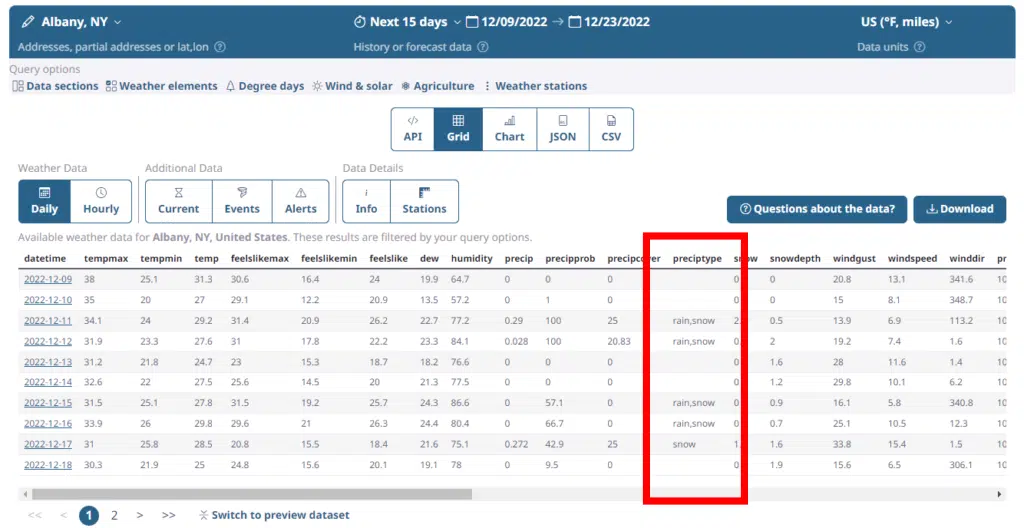
There are two types of ice issues that may be of interest. The first type is precipitation that falls out of the sky as ice. This can be very hazardous to travelers as the ice may then coat roadways and travel paths.
In Visual Crossing Weather data ice that falls as precipitation will be shown in the preciptype column in Query Builder. It will typically be labelled as ice or freezing rain.
Remember that while the actual precipitation amount may be very small, nearly any amount of ice can coat travel surfaces and make many types of travel, including walking, very dangerous.
Another way to have ice to make travel treacherous is by creating it due to moisture and freezing temperatures. In this case, you will want to look for recent precipitation and freezing temperatures at the time of the incident. This is easy to do using either the Weather History dashboard or the Query Builder interface.
In both tools, you will want to focus on the precipitation that fell recently enough that it may still be on the surface. If rain hits a cold surface, it can instantly freeze into hazardous ice. However, if rain remains liquid, it will typically flow away from travel surfaces within minutes or a few hours at most.
Melting snow, however, is a common way to get water that freezes into ice. This is known as refreeze and is commonly called black ice. For this situation to occur, you will need to have snow on the ground before the incident.
Querying snow depth is discussed above in the Flooding section. You will then need temperature conditions that cycle above and below the freezing point. The common times to observe this cycle are when daytime temperatures are above freezing and nighttime temperatures fall below freezing.
You can easily see this pattern by looking at the hourly temperatures using Query Builder.
If your event occurs either during a time of freezing temperatures or immediately afterward, and sometime recently before your event, temperatures were above freezing with snow on the ground, you should consider the possibility of black ice conditions.
Extreme Temperatures
Extreme temperatures alone are not a frequent cause of insurance claims. However, there are some cases, such as personal injury and crop damage, where temperatures can be sufficient to trigger an insurance claim.
Luckily, temperature data is one of the easiest types of weather data to find, and it is reported around the globe with excellent coverage.
If you are using the Weather History dashboard, you will find the temperature graph at the top of the middle section of graphs. You can easily see the highs and lows for any day as well as the “feels like” temperature.
Since feels like temperature is an estimation of how a given temperature feels to humans and animals, this can be important in cases involving personal injury due to extreme heat or cold.
If you are looking for temperature data for a specific hour, then you can use the Query Builder to find data for any exact time range of interest. As in the Weather History dashboard, you can find maximum and minimum temperatures as well as the maximum and minimum feels like temperature.
Summary
Weather data can be a critical addition to help support an insurance claim. Whether you are looking for wind, precipitation, storm events, or temperature, Visual Crossing Weather tools make it easy to find the data that you need in minutes.
In many cases, you can attach a copy of this data directly to your claim to show that weather conditions were conducive at the specific time to substantiate your claim. By doing the weather research work for your insurance company before filing, you add valuable credibility and make it easier for them to approve your claim.
Putting in the extra effort upfront can mean the difference between a complex series of questions and even denial vs. a successful claim that is quickly approved based on detailed facts that you have already provided.
The more facts that you provide and the easier you make it for your insurer to process your claim quickly, the more likely you are to receive a positive outcome.
FAQs: How to Find Past Weather Information for an Insurance Claim?
How can I find historical weather data to support an insurance claim?
You can use the Visual Crossing Weather History Dashboard to view weather data for any date and location. For more detailed results, including hourly or sub-hourly data, use the Query Builder. Providing this information helps your insurance company verify weather conditions at the time of the event.
Where can I get rainfall or flood data for a specific date and location?
Use the Weather History Dashboard to see daily rainfall totals, or the Query Builder for snowmelt and precipitation details. If your insurance policy includes separate flood insurance, this data can show accumulation trends and support your weather-related claim.
How do I prove wind and hail damage using weather records?
Visual Crossing offers both average wind speeds and gust data. Look for spikes in gusts over 50mph using the Dashboard or hourly data in the Query Builder. These reports can support your weather-related insurance claim when presented to your insurance adjuster.
Can I access hail, storm, or event-specific weather reports?
Yes. The Query Builder includes a weather events section where you can see reports of hail, fallen trees, and localized damage. These logs help back up claims tied to specific incidents and can be submitted directly to your insurer.
How do I find snow and ice data relevant to an accident or property damage?
Use the Query Builder to check for snowfall, snow depth, and freezing conditions. You can also verify precipitation type (such as freezing rain or ice) and surface refreeze conditions—valuable for proving slips, traffic accidents, or frozen pipe damage to your insurance provider.
What’s the best way to get hourly weather data for a claim?
The Query Builder lets you pull hourly weather records for temperature, wind, and precipitation. For more details, Visual Crossing also offers access to sub-hourly station data when precise timing is critical for supporting the claims process.
Can extreme temperatures be used as evidence in an insurance claim?
Yes. If extreme cold or heat contributed to crop loss, burst pipes, or injury, use the Dashboard or Query Builder to show temperature and feels-like conditions. Including this data in your documentation can help the insurer promptly understand the basis of your weather-related insurance claim.