

Weather data has manifold utilization in the SAS Viya platform.
Ranging from Historical Weather Data to analyze your business impact in SAS Visual Analytics or SAS Visual Statistics; use bulk downloaded weather data to discover correlations in SAS Data Science or SAS Visual Machine Learning to use the weather forecast to enhance predictions in SAS Visual Forecasting.
The data load can be manual or automated using custom connectors to load it directly into a CASLib using Cloud Analytic Services (CAS) actions via REST API or PROC HTTP to download CSV or Json files directly from the Visual Crossing Server.
For this tutorial we will stick to the manual file upload. This allows a setting up test cases with very little effort to justify the business value.
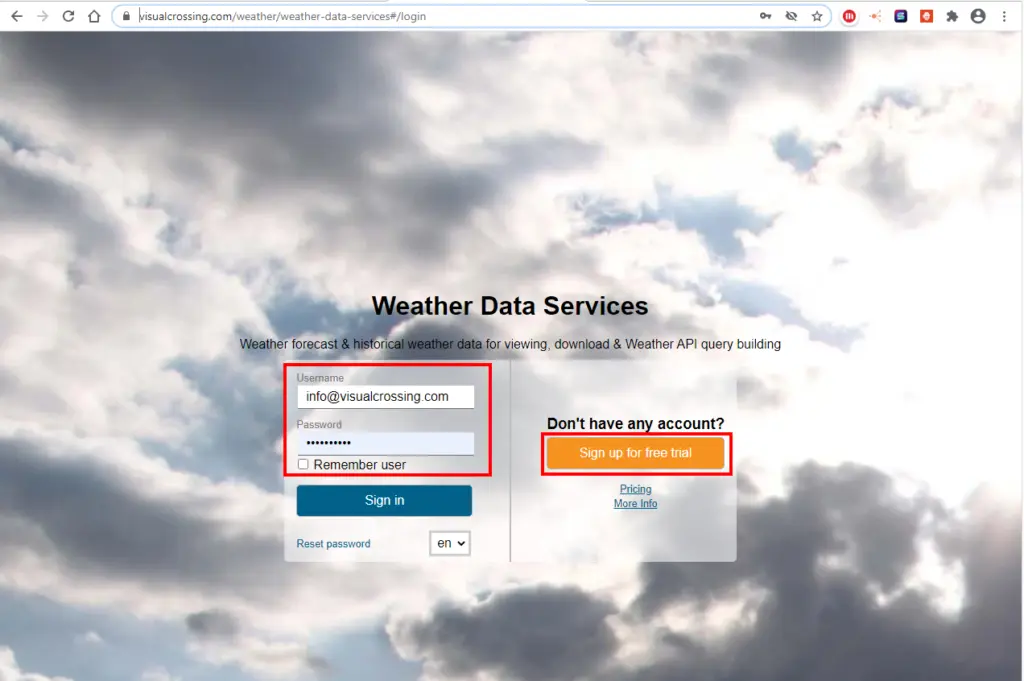
Step 1 – Log into Visual Crossing Weather Services and upload your locations
The first step is log in to Visual Crossing Weather Services. if you don’t have an account, you can create a free one.
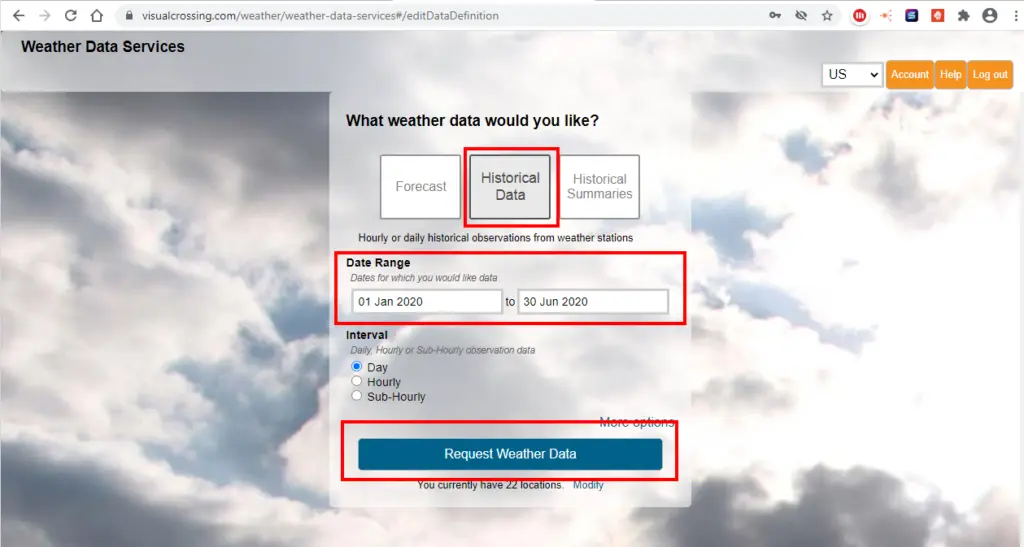
Step 2 – Request Historical Weather Data
On the query type selection page you can select the type of data you want to download.
The options are forecast, weather history queries, historical data summary reports, and hourly data. The tutorial will follow the steps for the option ‘Historical Data’. Please see those or reach out to us if you need more information on the other options or browse our tutorial and video section for more details.
Select the ‘Historical Data’ option, chose your time frame and click the ‘Request Weather Data’ button . Fro this example we chose the first quarter of 2020.
Step 3 – View and download the historical weather data
The default view for the query results is the weather calendar. This view provides a simple overview of the result data. To see all columns you can switch to the ‘Raw Grid’ mode as well. To further analyze the data you will need to download the full data set by clicking the ‘Download all data’ button.

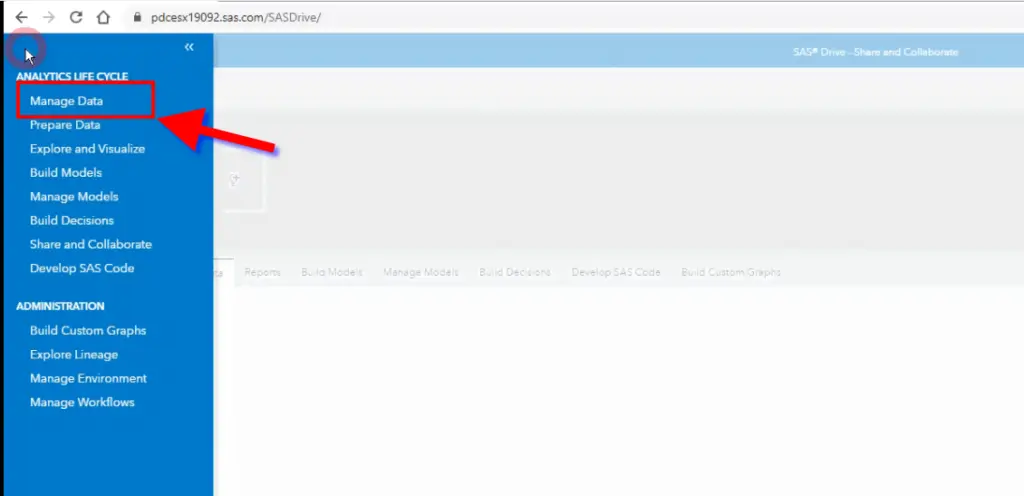
Step 4 – Load your historical weather .csv file into SAS Viya
Once logged in on your SAS Drive select the ‘Manage Data’ entry in the ‘Analytics Life Cycle’ section of the menu.
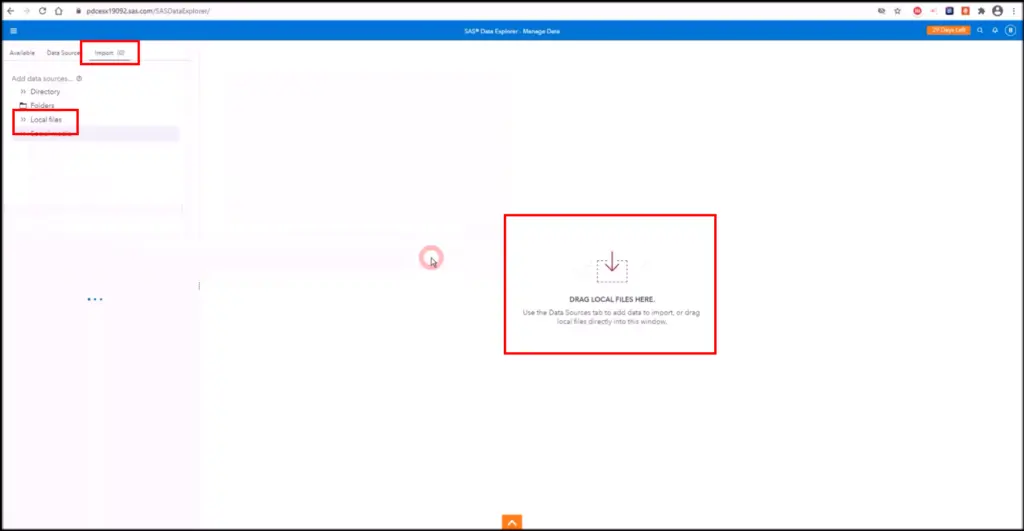
Now you can upload the weather data you downloaded as .csv file in Step 3 in the ‘Manage Data’ editor.
To do so navigate to the ‘Import’ tab and select ‘Local files’ from the ‘Add data sources…’ ,menu and either drag your file directly onto the drop zone labeled ‘Drag local files here’ or select it from your file explorer.
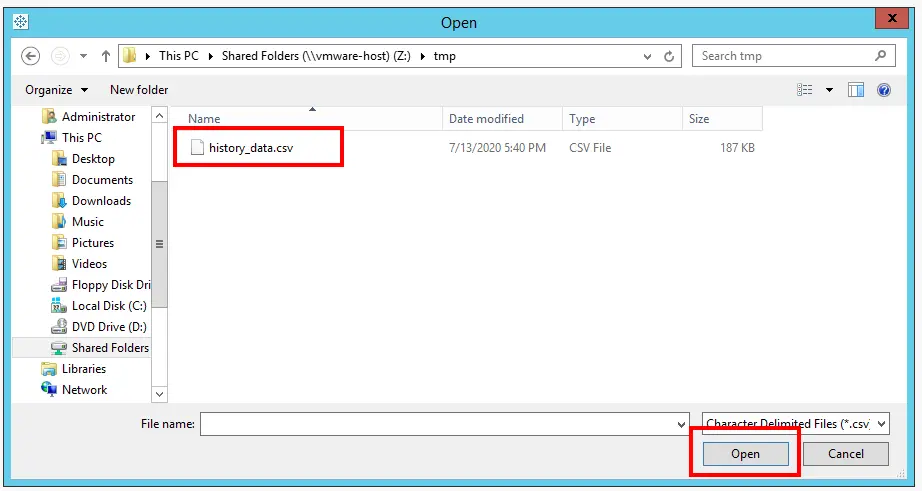
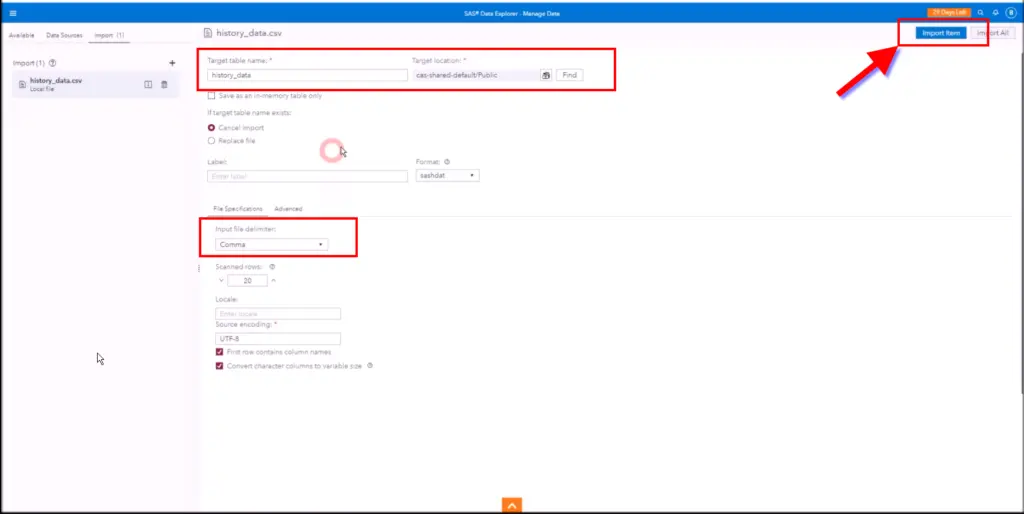
Step 5 – Review options and import the data
Select a table name and location verify the file specifications like ‘input file delimiter’ and encoding and click the ‘Import Item’ button
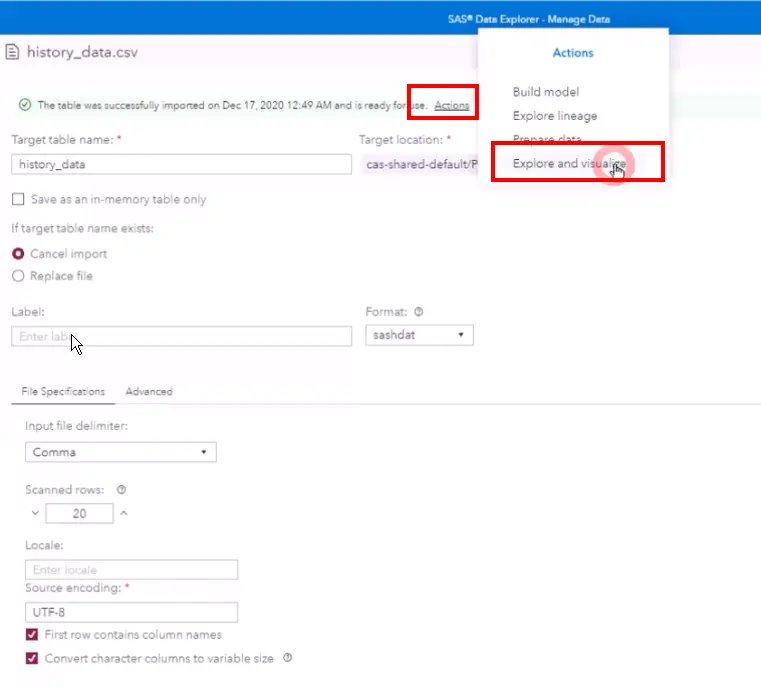
Step 6 – Explore and visualize your data
Once finished the weather data is available throughout your SAS Viya platform. In this scenario we start a simple visualization directly from the ‘Manage Data’ editor.
Simply click the ‘Actions’ link from the ‘finished importing’ message and select the ‘Explore and Visualize’ entry.
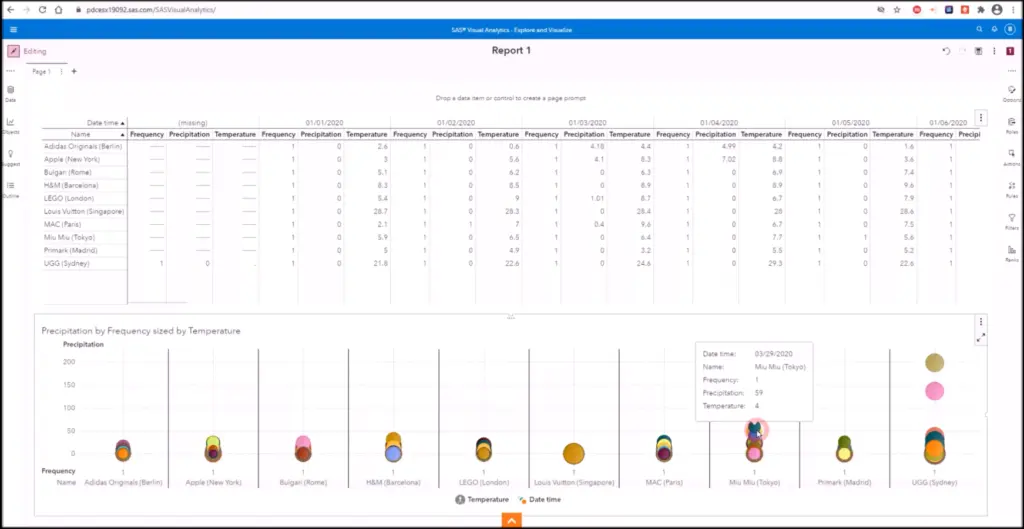
Step 7 – Format your report
Step 6 takes you directly to the ‘Explore and visualize’ application. You will now have the full power of SAS Visual Analytics & SAS Visual Statistics module to design your report. SAS Visual Analytics & SAS Visual StatisticsSAS Visual Analytics & SAS Visual Statistics
For more information on the details regarding our weather metrics, please see our Weather Data Documentation.
Questions or need help?
If you have a question or need help, please post on our actively monitored forum for the fastest replies. You can also contact our Support Team.