

Domo is designed to integrate data from multiple sources. A natural extension is integrating weather data directly into the platform. Weather influences demand, operations, logistics, and customer behavior across industries, making it a powerful external data source that enhances forecasting, planning, and decision-making.
Step 1 – Start with the Web-based Query Builder
If you don’t already have a Visual Crossing Weather account, you can create one for free by following our article that details the sign up steps. Once logged in, go to our web-based Query Builder where you can easily build your weather data query.
- Build the Query: Use the Query Builder to select your location(s) and the type of data (e.g., “15-day forecast” or “History”).
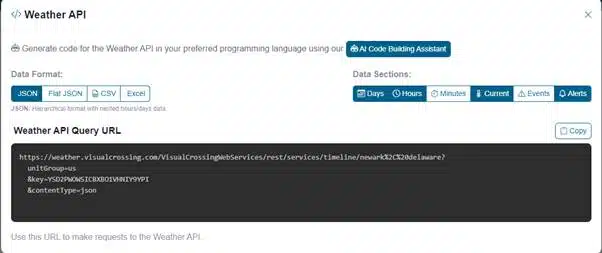
- Copy the URL: * Click the API button in the toolbar.
- Set the format to JSON.
- Copy the generated URL. It will look like this:
Step 2: Set up the Domo Connector
1. Select the Connector
- Log in to Domo and go to the Data Center.
- Click Connect Data
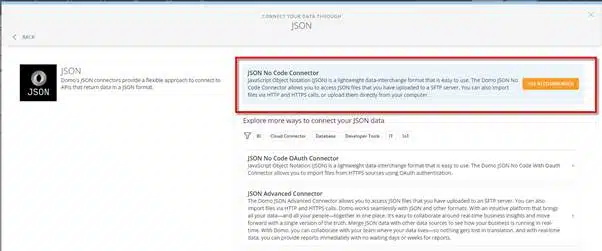
- Select the JSON button
- and on the next screen the JSON No Code Connector
- Enter Credentials
- Enter a name for your connector
- In the Credentials pane, you generally won’t need a username/password because the authentication is handled via the key parameter in your URL. So select None from the Drop Down.
- Connection Type: Select HTTP Request.
- HTTP Method: Select GET.
- URL: Paste the API URL you copied in Phase 1.
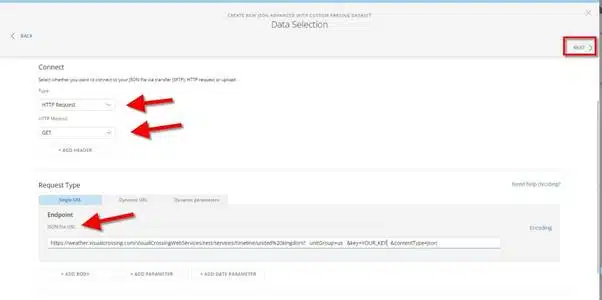
- Click Next.
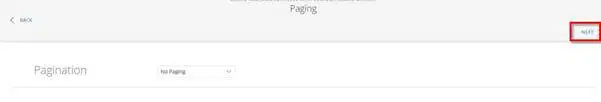
- Leave the paginantion setting at ‘No Paging’ and click Next
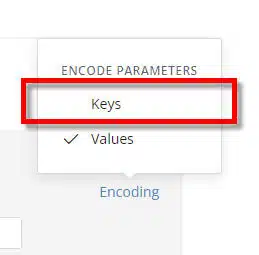
- Set the encoding to ‘Keys’ and click Next.
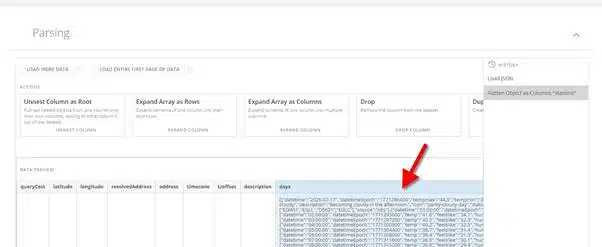
- Data Selection (Parsing): * Domo will attempt to “flatten” the JSON.
- Visual Crossing’s Timeline API usually nested data under days. You will likely need to select the days object to expand the daily weather rows into individual records in your Domo table.
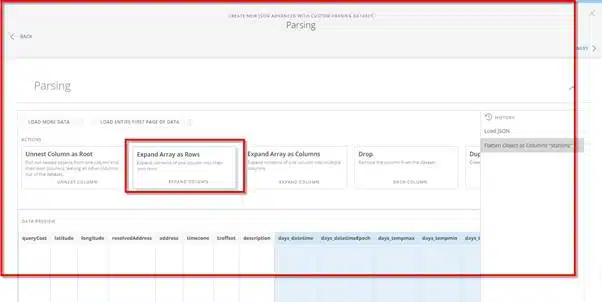
- Select the ‘Expand Array as rows’ option
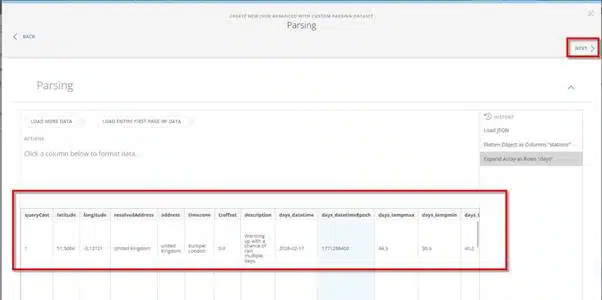
- Verify your table in the preview and click Next.
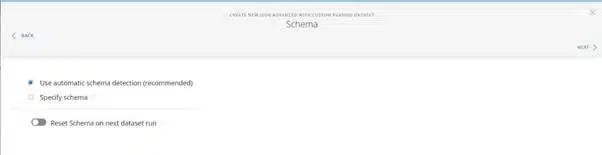
- Use the recommended automatic schema detection if not needed differently.
Step 3: Automate
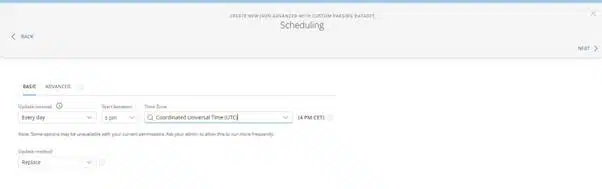
- Scheduling: Set the update frequency (e.g., Every day or Every 6 hours) to ensure your weather forecast stays current.
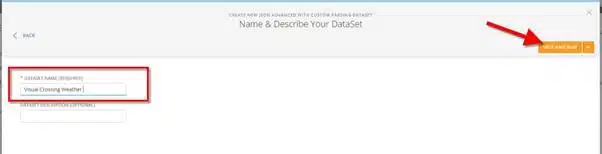
- Naming: Name your DataSet (e.g., “Visual Crossing – Daily Forecast”).
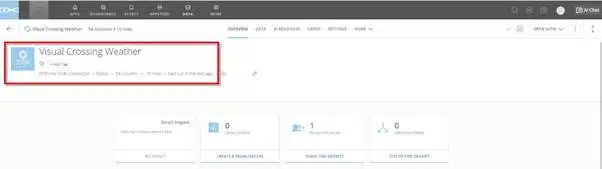
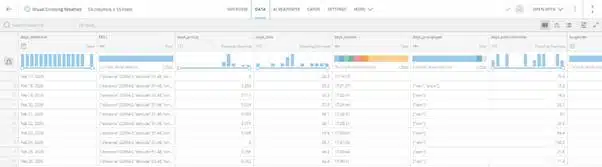
Step 4: Visualize
Now you are ready to use the weather data in your daily analysis.
Questions or need help?
If you have a question or need help, please post on our actively monitored forum for the fastest replies. You can also contact our Support Team.