

This articles shows how to download weather forecast data as a standard Excel file format that can be opened into Microsoft Excel or imported into other applications that understand the Microsoft Excel XLSX format.
If you would prefer, you can also download weather data in CSV format. See how to download weather forecast data or weather history data as CSV format.
Step 1 – Open the Visual Crossing Weather Data Page
To start download the weather forecast data, navigate to the Visual Crossing Weather Data page. Then we need to click on the link to go to weather data download page near the top of the page.
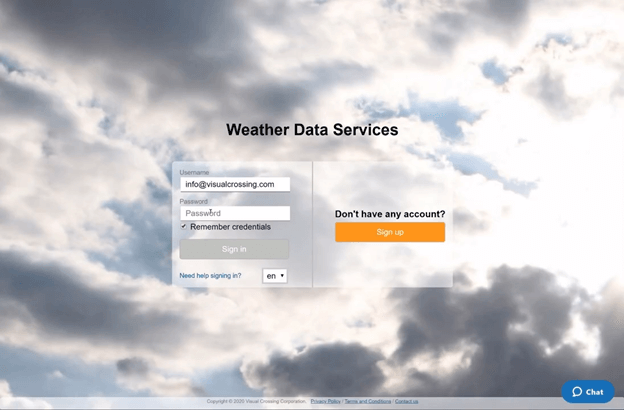
Step 2 – create a free weather data account and sign in
Once on the log-in page, you will need to sign into your Visual Crossing Weather account. If you don’t already have an account, you can click on the orange button on the right side of the login prompt. Signing up for a free account will give you immediate access to a full 15-day weather forecast for any location around the globe.
Step 3 – enter a location address for weather data
For this example, we’ll select the option to manually enter a location address to use for the weather forecast. However, if you have a sheet of addresses or a list in a text file you could use those directly instead.
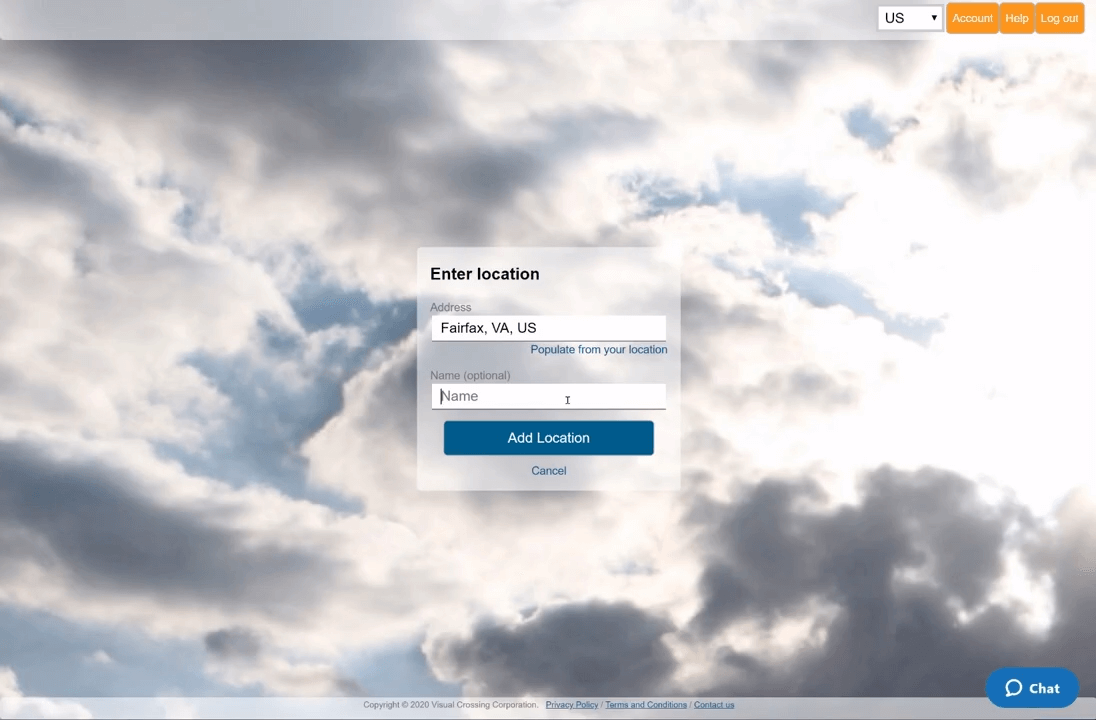
For the address, we’ll tell the system to use our current location by clicking on the “Populate from your location” link below the location text box. However, we could instead manually enter an address, a city name, or a postal code. Optionally, we can also give the location a friendly name for our own reference in the output data. This feature can be useful when you are comparing multiple locations in the same dataset.
Step 4 – choose the weather data query type
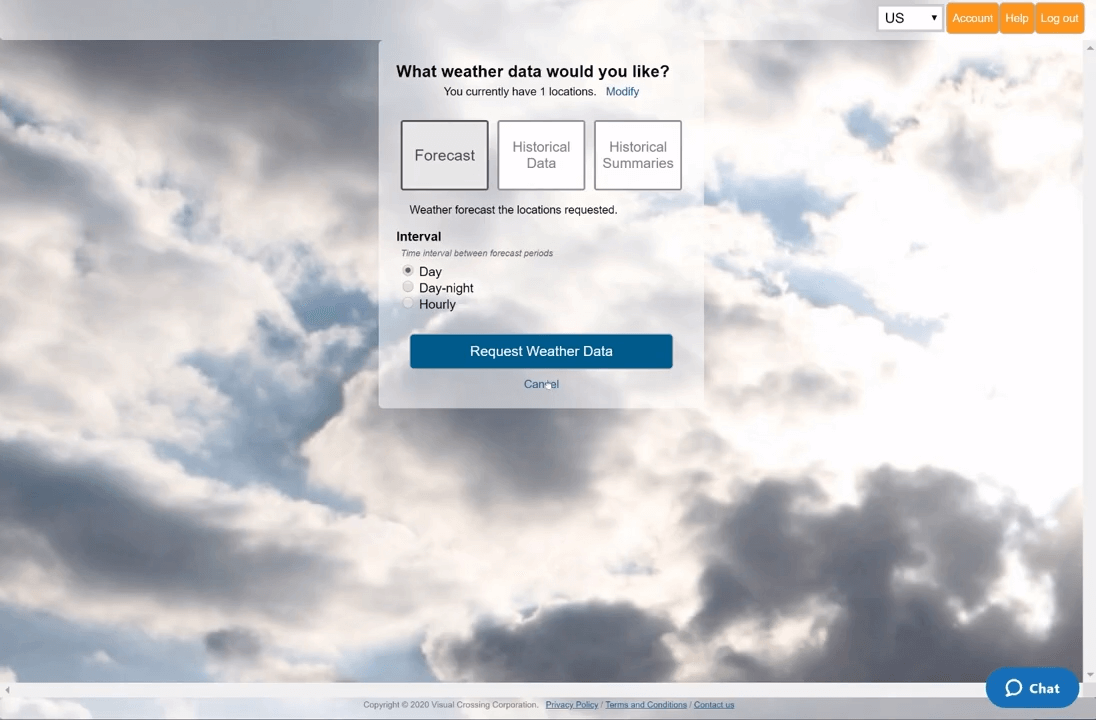
Next, we need to choose the query type. Since the default Forecast option provides a 15-day daily weather forecast, we can just accept the default for the purpose of this tutorial. However, in this panel there are other options as well including weather history queries, historical data summary reports, and hourly data.
These are among the many options covered by our other tutorials and videos. Please take a look at those or reach out to us if you need more information on these options.
Step 5 – request the weather forecast data
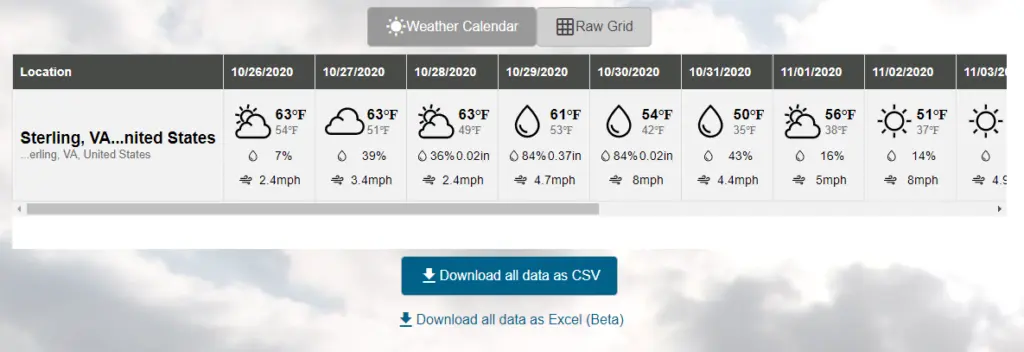
When we run the query the default view is the weather calendar. This view provides a simple overview of the result data. You will notice that if we entered a friendly name for the location, it will be shown here. The calendar view is most useful for comparing data from different locations side-by-side.
Step 6 – View the full weather forecast data view
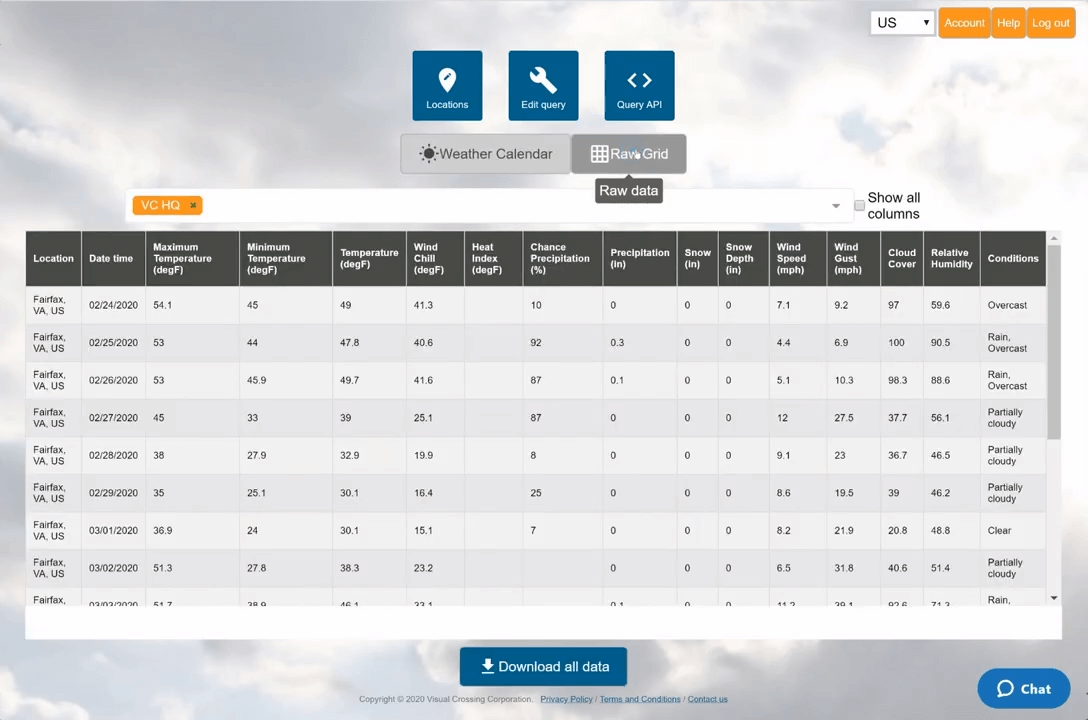
To see more details we can change to the grid view by clicking the “Raw Grid” button near the top of the page. This view gives a single row for each record in the forecast data. In this example, we will have one row of forecast data for each day of the 15-day forecast at the location we selected earlier.
You can see the various weather metrics that are provided in the output data. These metrics include common values such as temperature, precipitation, and wind as well as less common value such as heat index, cloud cover, and wind gusts. For more information on the details and how to use all of our weather metrics, please see our weather data documentation.
Step 7 – add a second location (optional)
To add a second location, we need to click on the Locations button at the top of the window and then follow the steps that we used earlier to add an additional location manually. That is, after clicking on the Locations button, we click on the Add Manual button and then enter a second location.
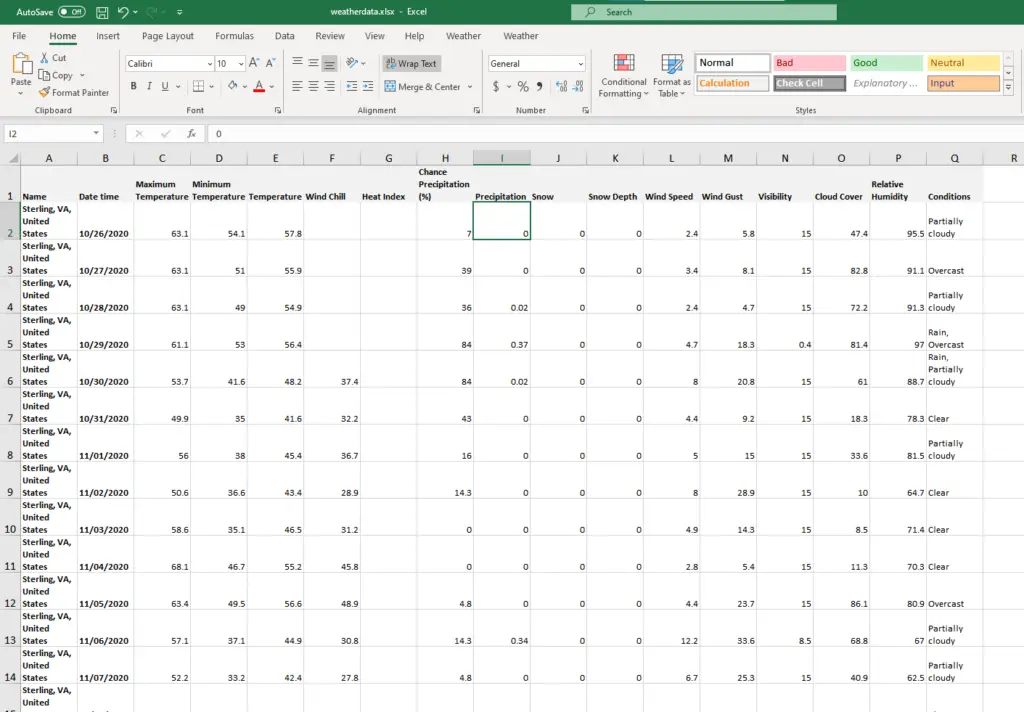
Step 8 – Download the weather data as a Microsoft Excel XLSX file
Then, when we rerun the weather query, we can see that the calendar view shows the two locations together for comparison. If we gave each location a friendly name, that name will be shown here to allow us to easily recognize them.
We could also switch to the grid view again to see more data details. However, most importantly for this exercise, we can click the “Download all data as Excel” link at the bottom of either view to download a Microsoft Excel xlsx file.
This file opens directly within Microsoft Excel and will give us the full Excel functionality for viewing, visualizing and manipulating the weather data.
If you would like to learn more about using Visual Crossing Weather options such as history data, multiple location import, and use within other analysis tools please see our other tutorials.
Questions or need help?
If you have a question or need help, please post on our actively monitored forum for the fastest replies. You can also contact our Support Team.