

Yield losses are often due to invisible field conditions, such as shifting soil moisture content and subtle temperature shifts. Soil moisture and temperature data enable estimation of potential yields by identifying crop stresses, improving planting schedules, and optimizing irrigation. With local-scale soil moisture and soil temperature forecasts, agronomists and agribusinesses can refine their automation systems to reflect real-time soil conditions, not guesswork or averages.
Why Yield Forecasting Breaks Without Soil-Level Conditions
Crop yield forecasts that rely solely on above-ground conditions, such as air temperature or precipitation, analyze only half of the available data. Additionally, soil conditions can vary significantly across fields, even when obvious weather conditions appear identical across the area.
Without current soil moisture and temperature data, yield forecasts drift, and thousands of dollars in crops could be lost. Thankfully, these datasets are collated and incorporated into weather APIs. The Natural Resources Conservation Service (NRCS), a division of the United States government, operates the Soil Climate Analysis Network (SCAN), which supports natural resource assessments and conservation activities.
A typical SCAN site assesses the in-situ soil moisture profile at several depths. These are combined with other sensor assessments, such as air temperature, relative humidity, solar radiation, wind speed and direction, liquid precipitation, and barometric pressure, to provide a complete picture of conditions at that site.
As the SCAN system focuses on regional estimates in the USA, it may not have the high temporal resolution that farmers need, especially for national and international agribusinesses. These users can also rely on the NASA Soil Moisture Active Passive Mission datasets, which provide remote sensing estimates of soil moisture worldwide.
What Soil Moisture Data Reveals That Rainfall Data Cannot
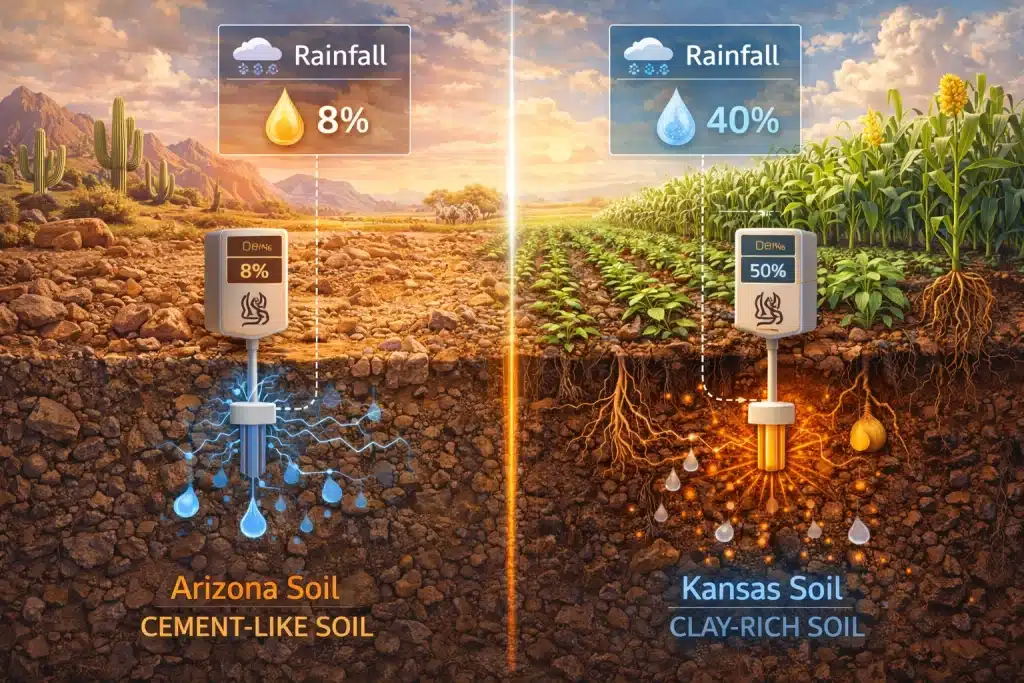
Rainfall averages do not show how much moisture a plant’s root system can access. All soilscape sites are composed of different organic and inorganic materials, which impact their drainage, evaporation rates, and runoff. For example, Arizona is known for having very hard soil, often called “cement-like.” This soil does not absorb water easily and contains many rocks, which is why the region has limited agricultural areas. In contrast, Kansas soil has a high clay content that absorbs water readily, making it ideal for crops like corn and soybeans.
Analyzing moisture data enables estimation of dry-down periods, the time after rainfall or irrigation when moisture levels drop due to evaporation and drainage. By understanding soil composition at project sites, teams can also identify saturation risk that could endanger plants and cause root rot. Lastly, inconsistent moisture, such as large rains followed by long droughts, induces crop stress and impacts yields.
How Soil Temperature Impacts Germination, Growth, and Yield Potential
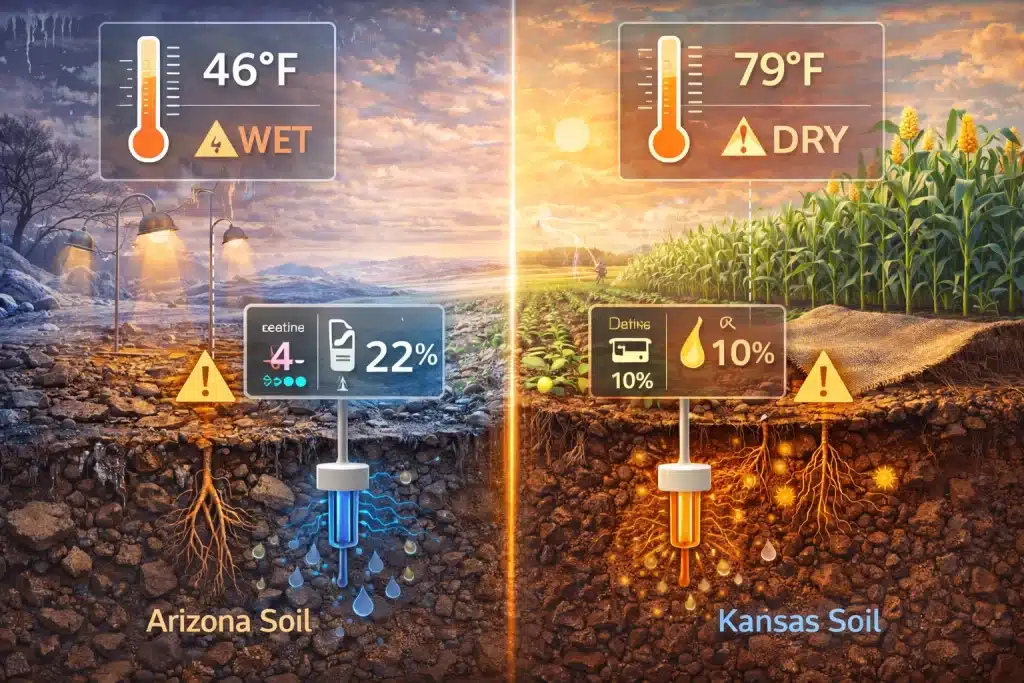
Soil temperature data collected at project sites allows farmers to estimate ideal planting windows, emergence speed, root development, and crop nutritional needs. This data also allows farmers to take quick measures when conditions fall out of ideal ranges. While cold soil slows growth, overheated soil can cause stress, particularly when combined with low soil moisture.
Combining Soil Moisture and Temperature Data for Better Yield Predictions
Soil moisture and temperature data sets work together to provide a comprehensive picture of current conditions. Through these values, you can identify risk periods and take appropriate actions. For example, the soil temperature may be high, but the moisture is evaporating quickly. In this instance, you can add more surface cover, such as mulch or burlap.
Another common issue is cold, wet soil, which can lead to drowned roots and slow germination. You can delay planting or use heat lamps to boost the temperature if necessary.
Using Soil Data to Improve Planting Decisions and Reduce Replant Risk
These data sets serve as decision tools, especially when determining which intended fields should be prioritized during planting. By using planning software integrated with temperature data, you can select the optimal planting dates, avoid poor emergence conditions, and avoid replanting.
As an example, assume that a certain field has optimal conditions for planting soybeans; the soil temperature is around 60°F, and soil moisture sensors read 10-30 cb (kPa).Another field has lower temperatures and a sandier soil profile, which may suggest better suitability for root vegetables like carrots. Choosing the correct field for current conditions increases yield and reduces replanting needs. Regular monitoring also allows operators to schedule their activities when conditions are expected to reach the right thresholds, enabling faster germination and more consistent yields.
Using Soil Data to Optimize Irrigation Timing and Water Allocation
Agricultural areas often incorporate soil moisture sensing controllers into their irrigation systems to provide data about soil moisture at different depths. When combined with soil temperature data, these tools help identify when crops are approaching stress rather than just when rainfall is low.
These sensors prevent under- and over-watering, reduce water waste, and protect yields, particularly during heat waves or other unusual events. Agronomy and operations teams can use this wireless sensor technology to schedule irrigation events with greater confidence, maximizing resource use.
Where Visual Crossing Soil Layers Fit Into Forecasting and Farm Workflows
Visual Crossing provides soil temperature and moisture data layers as part of our weather API, offering a comprehensive picture of all agricultural weather needs. Users can check forecast models, review radar maps, examine historical data, and cross-check with soil moisture and temperature, all in one dashboard.
This data helps operations teams forecast yields, plan planting or replanting events, and schedule irrigation. Our data sets go through multiple validation nodes and are business-ready for simple integration into any dashboard, planning system, or agribusiness tool. The Enterprise version is scalable for larger businesses and can support refresh cycles of varying durations, even 15-minute increments.
FAQs About Soil Moisture and Temperature Data
An optimal estimator should provide daily updates. Smaller operations may use weekly updates, particularly if the weather has been consistent and the soil moisture content is unlikely to rapidly shift.
Soil moisture data measures moisture levels below the surface, which can differ significantly from precipitation levels. Certain soil types hold water better than others; for example, soil with a high clay content acts like a sponge and can remain damp even with little rain. Rainfall totals consider the overall precipitation, which may not fully penetrate the ground and be accessible to root systems.
Soil temperature is one of the primary catalysts for germination and plant growth. Different plant species thrive in specific temperature parameters. For example, corn and soy are warm-season crops that require temperatures above 60°F, while cool-season crops such as broccoli or root vegetables will germinate at lower temperatures. Plants also have a maximum temperature they can tolerate before their roots die.
Knowing the soil temperature enables farmers to improve yields and reduce the need to replant certain fields.
Yes, this is a crucial component of soil temperature and moisture data. Understanding soil moisture profiles reduces over- or under-watering and helps evaluate dry-down periods, when the soil loses moisture after rain. Temperature data enables farmers to determine when roots are dormant or heat-stressed and adjust their irrigation schedules accordingly.