

Why ERA5 Data May Not Be Good Enough for Your Business
In the world of historical weather data, ERA5 is the giant everyone leans on. Produced by the European Centre for Medium-Range Weather Forecasts (ECMWF), ERA5 is a state-of-the-art global reanalysis model that blends satellite, radar, and station observations into a complete, gridded picture of the atmosphere going back to 1940.
For broad climate research or academic trend analysis, ERA5 is excellent. However, most commercial weather APIs simply repackage ERA5 data and call it “historical weather.” They skip the hard work of sourcing and blending actual, nearby ground observations. ERA5 was not designed to deliver point-level accuracy that a typical business requires, but rather general climate trends for large, generalized geographic grid areas across an entire planet.
At Visual Crossing, we refuse to take that shortcut of simply repackaging general climate grids. When your business decisions depend on knowing exactly what happened at a specific location, “close enough” isn’t good enough. We prioritize real measurements first, using gold-standard stations, radar, and other sources… falling back to ERA5 only when it genuinely improves the picture. Here’s why that matters, and how we deliver higher accuracy across every weather element.
1. ERA5: Limitations for Business
ERA5 runs on a ~31 km (19-mile) global grid, while its higher-resolution land-focused companion, ERA5-Land, improves this to approximately 9–11 km (roughly 6–7 miles). Even at this finer scale, every point inside a single grid cell is still assigned very similar or even identical values. The primary concerns with using ERA5 for business operations are:
- Lack of delivery infrastructure under scale or high concurrency – At its core, ERA5 is a data source, not necessarily an infrastructure for delivering historical weather data at bulk scale under high concurrency.
- Inaccurate for business needs because of smoothing and large grid areas – One side of a grid cell could have experienced a heavy thunderstorm while the other side stayed completely dry. For operational use cases (construction scheduling, insurance claims, crop modeling, energy yield forecasting), this smoothing creates real problems. Whether using the 31 km ERA5 grid or the 9–11 km ERA5-Land grid, an averaged model output cannot accurately tell you whether a specific job site was rained out or whether a solar farm just a few miles away received full sunshine.
- Lack of recent history and processing delays Because ERA5 is built for long-term climate analysis rather than real-time business needs, it has a built-in processing delay of 4–7 days. This leaves a critical gap that must be filled by the most recent forecast run which are significantly less accurate than finalized historical data.
The Visual Crossing approach
ERA5 was designed to create a lightweight, consistent view of the entire world for general climate analysis and broad research. It excels at that global scale, but it was never built for hyper-local business decisions. Its end goal is to deliver a worldwide grid of averaged data… both the goal and final delivered product is very different from what they typical business requires.
Visual Crossing took a completely different path. We designed our system from the ground up around fast, accurate point-level data for any latitude and longitude on Earth. That means we start with point-specific, station-level observations from high-quality weather stations and other sources and only blend in ERA5 when no other quality sources exist.
Delivering this level of precision requires far more advanced delivery systems… real-time collection from thousands of stations, rigorous quality checks, intelligent gap-filling, and on-the-fly interpolation across multiple stations and sources. All of which are optimized for speed and accuracy. The result is true location-specific history, not a grid-averaged estimate.
2. Best Historical Sources by Weather Element
Not all data types are created equal. Here’s a clear technical comparison of the optimal sources — and why Visual Crossing chooses them:
Temperature & Humidity
- Best source: Direct station measurements at 2 m height (WMO standard).
- Why: Physical sensors capture the exact air humans, crops, and equipment experience. ERA5 reanalysis is smoothed and can miss micro-climates or inversions.
- Visual Crossing: Prioritizes nearest high-quality stations; ERA5 only as fallback for remote areas.
Precipitation (Rain & Snow Totals)
- Best source: Ground rain gauges + radar-derived estimates (e.g., NEXRAD/MRMS in the US).
- Why: Gauges give precise accumulation; radar fills spatial gaps and captures intensity. ERA5 precipitation is entirely modeled and often underestimates convective storms or overestimates in complex terrain. Snow totals are especially tricky in ERA5 because it struggles with snow-vs-rain phase detection.
- Visual Crossing: Combines gauge data with radar when available; ERA5 only when both are absent. This is why our snow and rain totals consistently outperform pure reanalysis in validation studies.
Solar Radiation / Global Horizontal Irradiance (GHI)
- Best source: Measured pyranometer data or high-resolution satellite-derived irradiance (e.g., NSRDB, CERES).
- Why: Direct measurements or satellite cloud-cover algorithms are far more accurate than ERA5’s modeled radiation, which relies on coarse cloud assumptions.
- Visual Crossing: Pulls real pyranometer and satellite sources first; ERA5 only for extreme remote locations.
Wind Speed & Direction
- Best source: 10 m anemometer stations (WMO standard).
- Why: Surface roughness and local obstacles make modeled wind unreliable. ERA5 wind at 10 m is a good starting point but lacks local fidelity.
- Visual Crossing: Station-first, with ERA5 fallback; we also offer hub-height (50/80/100 m) extrapolation using the logarithmic wind profile when needed.
Soil Moisture & Temperature
- Best source: In-situ soil probes or specialized land-surface models calibrated to stations.
- Why: ERA5 soil layers are purely modeled and often lag real conditions by days.
- Visual Crossing: Uses observed or calibrated soil data where available, with ERA5 as the intelligent gap-filler.
3. True Flexibility: You Choose the Source
While competitors lock you into a single ERA5 feed, Visual Crossing gives you control at the query level:
- Use the -obs setting (observation focus) to force station-first data.
- Within the Station-first option users can also choose the number, quality and distance of stations to consider in your query.
- Interpolation of stations by distance and elevation help to pinpoint data to your exact location, not a city, county or other geographical estimate.
- Add the -remote flag only when you explicitly want ERA5 for remote or gap-filling scenarios.
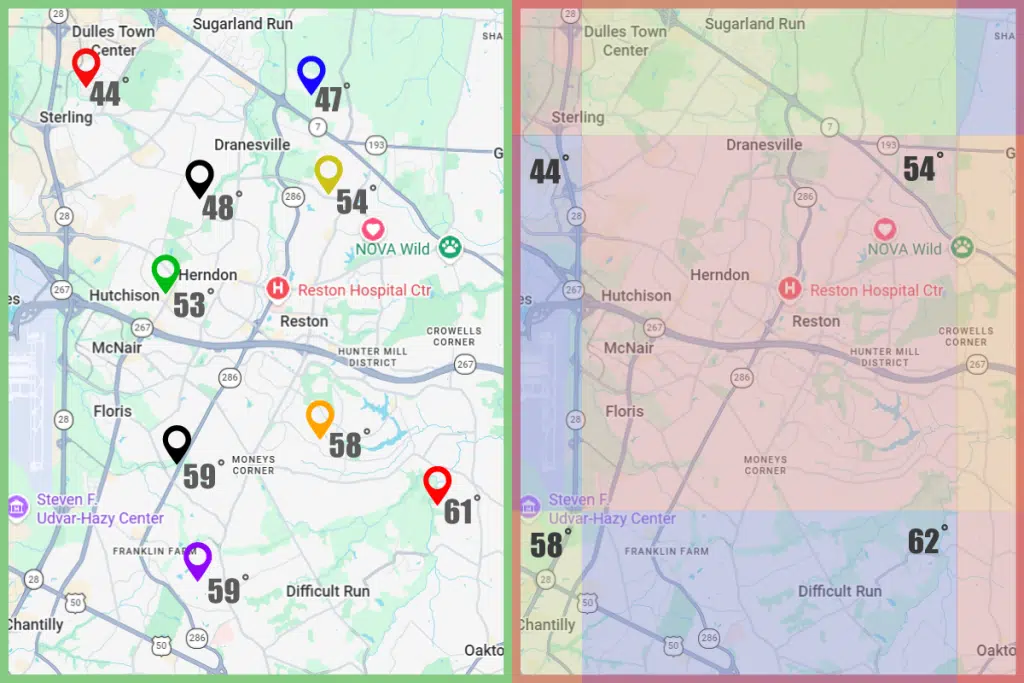
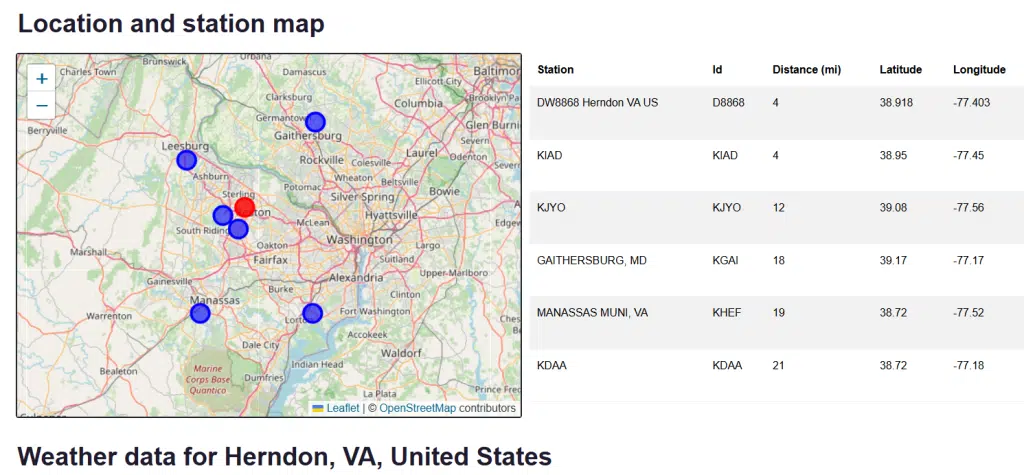
As the data scientist in charge, you decide how much “model” vs. “measurement” you want. Here is an example of an area that is station supported and where businesses can benefit from:
Here is a great example of worldwide area that doesn’t have strong support from stations and requires other support from “remote” resources such as ERA5:
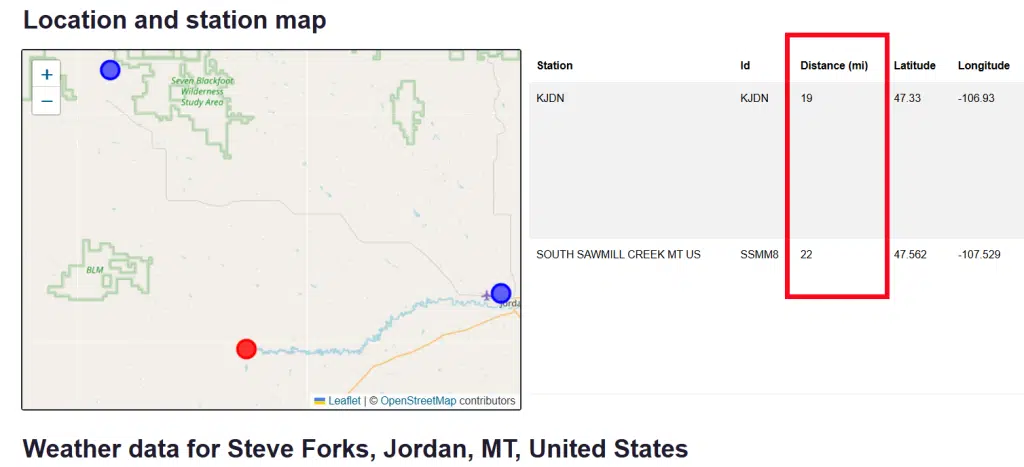
Notice how there are only two stations nearby and are 20 miles away. This can also be helped ifpersonal stations are nearby, but the core source of major stations is not supporting this area and it can benefit from other sources and even ERA5. Interpolation can help but the accuracy benefit in areas like this can be offset. With Visual Crossing, this switch is automatically deployed in the default settings so users don’t have to think about what is best and most accurate for them. Our system is designed to deliver the best data for your exact geographical point at all times.
The Visual Crossing Difference
The “easy path” taken by other weather API providers and simply serving up ERA5 saves them money and engineering time, but it costs you accuracy. ERA5 was designed as a climate analysis tool for broad global trends and long-term research. It was never built for the precise, point-level historical analysis that businesses require on a daily basis. Many providers are using a climate tool as a weather tool… and the distinction matters for accuracy.
At Visual Crossing, we took a different approach. We built our system from the ground up with an Observation-First philosophy, prioritizing real station measurements while intelligently using ERA5 only as a fallback when no nearby observations exist. This method is objectively better suited for forensic meteorology, proving exactly what happened at a specific location and for operational logistics, where every mile and every hour can impact decisions and results.
By combining the best of global modeling with a relentless focus on station-level precision, Visual Crossing ensures that your historical analysis is based on reality, not just a grid-averaged estimate.
Don’t settle for “close enough”.