

The seamless integration of accurate weather forecasts with air quality data through an API enables comprehensive environmental monitoring, thereby improving public health. Weather API air quality analysis tools can be utilized for personal, governmental, and commercial purposes, allowing the general public and larger organizations to make informed decisions based on real-time air quality.

The Link Between Weather and Air Quality
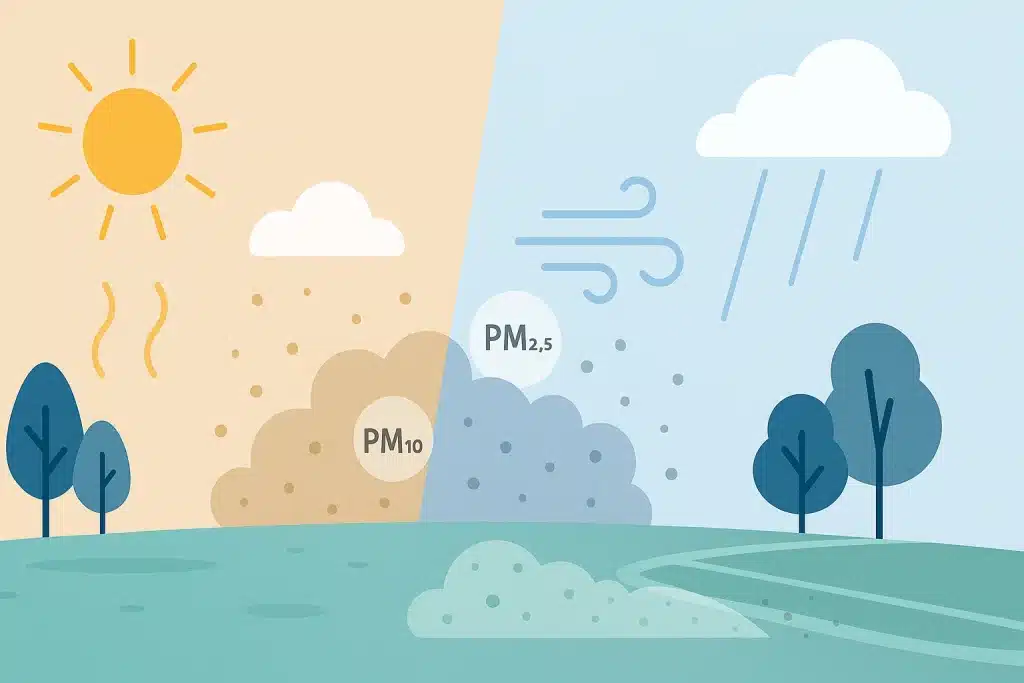
The weather-air quality relationship is influenced by numerous factors, including wind speed, temperature, humidity, and rainfall.
For example, a hot, humid, and still day is going to have a lower air quality index. This is because the pollutants will not move and are trapped by the moisture in the air, while the heat makes them more reactive.
A cold, cloudy, windy, and dry day will have better air quality because pollutants are mobile, have less energy for chemical reactions, and are not reacting with sunlight.
As such, combining weather data with air quality data provides a more comprehensive picture of current conditions in a given location and helps determine whether the public will experience health effects.
Why Weather API Air Quality Analysis Matters
A weather API air quality analysis provides a more reliable assessment of real-time conditions than could be achieved through separate datasets. Through this high-resolution and comprehensive data, users receive real-time updates across multiple parameters.
Programmatic API means that users do not have to refresh continually; the weather information is continuously retrieved from the cloud, combined with air quality datasets, and integrated into their application or websites.
APIs are also scalable, meaning they can be used by casual users and enterprise developers alike. Regardless of project size, users can access the features they need to monitor air quality and receive health recommendations.
Key Components of an Air Quality Comprehensive Analysis
A comprehensive air quality analysis should provide details on several types of pollution, including the following.
- Particulate Matter (PM): These small particles are typically caused by incomplete combustion. They are sorted by size, including PM2.5 and PM10.
- Ozone: Comprised of three oxygen molecules, ozone is not directly emitted but results from chemical reactions between other molecules, like nitrogen dioxide and volatile organic compounds. This chemical attacks the lungs and can result in shortness of breath.
- Carbon Monoxide: With one carbon and one oxygen molecule, CO comes from the incomplete combustion of fuels. Because it replaces carbon dioxide in the bloodstream, carbon monoxide is an extremely deadly gas that can cause nervous system issues and even death in high concentrations.
- Nitrogen Dioxide: This highly reactive gas comes from automotive emissions and power plants. Nitrogen dioxide is an extremely irritating chemical that can cause asthma and other respiratory issues. Its chemical reactions also cause acid rain, which harms the environment.
- Sulfur Dioxide: Sulfur dioxide also comes from fossil fuel combustion, but it can also be found naturally from volcanic eruptions. It has a strong, foul smell, and it also irritates the mucus membranes, causing coughing and watering eyes. Over time, it results in inflammation and breathing difficulties.
How Weather APIs Power Data Integration
Weather APIs are a vital bridge between weather data and air quality index data. Through an API, developers can simplify their data collection, aggregation, and visualization.
With an API key that includes both weather and air quality data, users can combine this information to get a more comprehensive picture of current conditions while also forecasting future trends in air quality.
Combining Historical and Real-Time Data
Historical information about air quality, when combined with real-time updates, helps users forecast potential conditions. For example, the hourly forecast may indicate that pollution levels are higher during rush hour. By examining historical data, users can observe how air quality changes in response to seasonal trends in humidity and UV radiation, which helps them predict what the air quality index may be on a given day.
The Role of Temperature and Humidity in Air Quality
Pollution is strongly influenced by heat and humidity because it involves different chemical reactions. For example, hot weather often means more smog because nitrogen dioxide is converted into ozone.
Humidity traps particles, and the increased moisture may also result in more chemical reactions. As such, a hot and muggy day is going to have worse air quality than a cold, dry day.
Wind and Airflow Patterns
Wind direction and speed will affect whether pollution spreads and dilutes or is concentrated. On a windy day, particles will disperse far from their source, resulting in reduced air quality over a larger geographic area.
The wind direction determines where the particles move. For example, wildfire smoke may move into an area from a distant source, causing difficulty breathing and watery eyes for those even thousands of miles away.
As such, including these parameters in a weather API improves modeling accuracy, as it helps determine where pollution will spread and allows people to predict changes in the air quality index.
Cloud Cover, Rainfall, and Pollution Washout
Precipitation and cloud patterns also determine whether air pollution remains concentrated or is washed away. Cloud cover reduces the UV radiation, which limits chemical reactions and can improve air quality. Heavy rainfall can remove pollution from the air, but it can cause acid rain and damage buildings or crops. Incorporating this weather data into air quality API improves accuracy while predicting what the effects of precipitation or cloud cover could be.
Geographic and Seasonal Differences
Air quality changes significantly by season and location, due to both weather and human factors. Coastal areas are typically windy, which pushes pollution away from land and into the water. Urban areas not only produce more chemicals due to emissions, but they also trap these particles, accelerating the chemical reactions that cause smog.
Season also matters. In winter, cold air reduces the number of chemical reactions, while summer means more heat and higher reactivity. Heavy rainfall in spring and autumn can wash away pollution and result in little or no risk to health. As such, a weather API-driven analysis enhances forecasting and enables more accurate models.
Visualization and Dashboards
While a climatologist or meteorologist will understand pollutant details and can benefit from the raw data, the average person will struggle to make sense of what these metrics mean. Visualizing air quality data by using APIs, such as an air quality map, enhances engagement and makes the information more accessible.
For example, developers could allow the public to review an hourly history of air quality, color-coded to indicate potential health effects at different pollution levels. This improves an app’s functionality while providing valuable insights to sensitive groups.
Integrating APIs for Actionable Insights
Weather API air quality analysis can be utilized to make alert systems, sustainability dashboards, or public health initiatives. For example, a utility company could make a free service page that warns its customers of when air quality is low so that they can make changes to their daily routine, like closing windows or limiting their air conditioner usage.
Benefits of Weather API Air Quality Analysis
Tracking air quality can help people prevent short-term damage arising directly from air pollution. However, it also helps municipalities and companies track pollution over time and make smart choices, such as where to place power plants, how to ease traffic congestion to prevent emergency conditions, and what emissions standards could reduce the risk of serious health effects.
Historical data also provides key insights for climatologists and environmental health specialists, as it allows them to forecast how certain factors can exacerbate or mitigate air pollution.
Challenges in Weather-Air Quality Integration
While both air quality data and weather data can be invaluable, integrating the two can sometimes be challenging. Firstly, different data formats will need to be converted into a unified format, which may compromise data integrity if not done carefully. For example, open data from a government source may not be in the same format as data from a personal weather station, making it difficult to combine the two.
Choosing an API like Visual Crossing, which provides both air quality and weather data, means that you can request both datasets in a single API response. The data is already cleaned and processed for your needs.
Another issue is missing datasets, which can be particularly challenging if you require global coverage. Certain parts of the world may have minimal data collection due to a lack of weather stations, resulting in blank spots on your map. However, using an API that incorporates a broad range of datasets reduces this risk and allows you to access air quality data from thousands of sources.
Emerging Technologies in Air Quality Forecasting
Air quality forecasting continues to improve thanks to technological advancements. Artificial intelligence and machine learning enable researchers to develop more precise forecasting models that incorporate thousands of parameters into one model.
The Internet of Things (IoT) is producing a continuous supply of real-time air and weather information around the globe. Using IoT, researchers can measure air pollution at precise coordinates, allowing for deeper insights into how pollution spreads or dissipates.
Pairing these innovations with weather APIs offers highly accurate air pollution forecasts, keeping the public safe and fueling a deeper understanding of how human activities influence the environment.
Practical Applications Across Industries
Numerous industries can benefit from integrating weather data with air pollution monitoring, including the following.
- Energy Companies: Energy companies can track their efforts to reduce emissions through APIs, ensuring they remain on target with their environmental goals. This can also help them plan where to place new power plants to ensure compliance with regulations.
- Logistics: Understanding the conditions that lead to high pollution enables logistics companies to plan routes that minimize emissions. For example, they can avoid congested highways to limit smog production.
- Environmental Agencies: Understanding the connection between weather and pollution allows environmental agencies to assess the impact of new regulations, identify companies that may not comply, and forecast future conditions based on the changing climate.
Future of Weather API and Air Quality Integration
API-based monitoring and forecasting are already highly refined, but further integration and technological advancements will enable highly accurate forecasting that protects health, reduces ecological degradation, and fosters smarter cities. With greater environmental data intelligence, both individuals and organizations can ensure a safe and healthy environment for generations to come.
Conclusion
Weather is closely connected to pollution, meaning that tracking both is the key to a comprehensive understanding of current conditions. An API enables you to seamlessly integrate both into your applications or datasets, creating a comprehensive 360-degree environmental analysis. This is crucial for reaching your sustainability goals and making smarter choices that reduce your environmental impact.
If you’re ready to harness the power of a weather API with air quality data, Visual Crossing is here to help. Contact us to discover our enterprise solutions, which can enhance your data-driven sustainability initiatives.
FAQs about the Weather API Quality Analysis
How does the weather influence air quality?
Weather influences the air quality index by determining when environmental conditions will amplify or mitigate the concentration and effects of certain chemicals in specific locations. As an example, hot weather accelerates chemical reactions, creating smog. High winds will disperse particles faster, resulting in widespread pollution.
Why is API integration important for air quality analysis?
Weather and air quality API integration allows for real-time monitoring of current air quality and the effects of weather conditions on pollutant concentrations.
What weather factors most impact pollution levels?
Weather factors that influence pollution levels include wind speed, temperature, humidity, and precipitation. Of these, heat and humidity are the most critical components, as they determine whether pollution is trapped in the air and the frequency of chemical reactions.
Can weather APIs predict poor air quality days?
Yes, a weather API can predict when air pollution poses the greatest threat to human health by considering how weather conditions influence the movement of these chemicals through the environment. By integrating these datasets, researchers and developers can help people take preventative measures, such as limiting their car travel.
How do temperature and wind affect pollution dispersion?
These parameters affect pollutant dispersion by determining the frequency of chemical reactions between pollutants and the rate at which they are dispersed from a particular location. High temperatures and UV radiation mean pollutants like ozone will be more reactive, which increases the concentration of other components, such as sulfur dioxide.
When wind speeds are high, pollutants disperse faster, which reduces the risk that the general public will experience more serious health effects. However, even on windy days, unusually sensitive groups may still be in danger.