

I think that I’m seeing bad weather data. What should I do?
Occasionally when reviewing weather data you come across a weather record that simply doesn’t seem right. Perhaps the precipitation is too high based on what you know about the location or perhaps the temperature is too low, and you know because you live there. At other times you may find missing data within your weather …
Continue reading “I think that I’m seeing bad weather data. What should I do?”
How historical weather data is updated
Visual Crossing combines multiple nearby weather reports into a single hourly report. This is done through interpolation which is a powerful feature of the Visual Crossing system for locations that are not near a major reporting station, or where the geography is such that it can create temperatures changes in a short distance. This feature …
How can I replace the Dark Sky API?
Visual Crossing Weather is the perfect alternative to the Dark Sky API. We not only have a superior weather API solution, but we can help you migrate your application to our API before Dark Sky turns off its API.
Calculating chill hours for fruit plants and trees

Many fruit plants and trees do not produce an optimal crop unless they experience a dormant period with lower temperatures. These dormant periods help the plant rest during the winter period. They also may regulate the plant’s development including the budding time. Unlike a plant hardiness zone, which indicate the coldest temperatures that a plant …
Continue reading “Calculating chill hours for fruit plants and trees”
How to download weather data for multiple locations
Downloading weather data for multiple locations in CSV, Excel, or JSON format is easy using our Query Builder page. In this guide, we will walk through the process of uploading a file of location or pasting in CSV data from the clipboard, composing a weather query, previewing weather data for these locations, and then downloading …
Continue reading “How to download weather data for multiple locations”
How to build a great Weather Dashboard
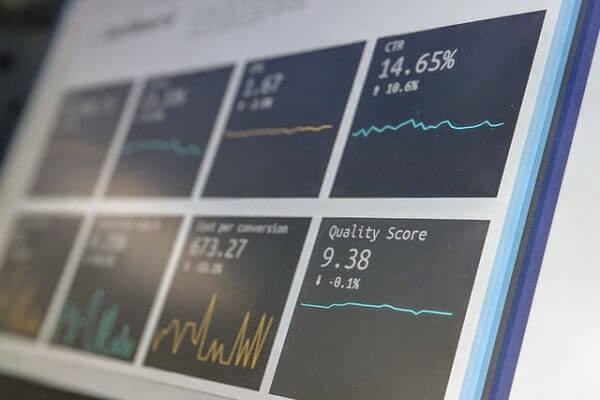
Dashboards are one of the most effective ways to communicate data to users. Originating, from the dashboard in cars and vehicles, data dashboards typically combine multiple data visualization elements such as charts, maps, grids and KPIs to provide users with a fast, concise, and clear way to interpret a set of data. For businesses, organizations …
Using Weather Data in your Open Source Project

Open Source software has become a critical component of our daily lives. From robust operating systems and servers, such as the software stack serving your this article, to client applications such as browsers and helpful desktop widgets, nearly everyone benefits from Open Source software daily. With Visual Crossing Weather, we are proud to give back …
Continue reading “Using Weather Data in your Open Source Project”
How to import weather data into Microsoft SQL Server

When you want to drive data analysis of all types including data science and business intelligence applications, loading weather data into a relational databased is often the first step. As one of the most popular database platforms in the world, Microsoft SQL Server is the backend datastore for millions of applications from homebrew to enterprise. …
Continue reading “How to import weather data into Microsoft SQL Server”
Best practices for segmenting your weather queries

When you have a large weather query, it is typically a good idea to segment it into multiple, smaller queries and then execute those separate individually. This is important for more consistent timing performance inside your application, debugging, and timeout avoidance among under reasons. In this article, we will discuss when it makes sense to …
Continue reading “Best practices for segmenting your weather queries”
Understanding the “fair use” system in Visual Crossing Weather

Visual Crossing Weather is the most powerful and cost effective way to obtain weather data for your data analysis project, weather app, or virtually any other weather use case. We pride ourselves in providing the highest-quality weather data at the most affordable prices. In order to protect our user community from runaway scripts, malicious abusers, …
Continue reading “Understanding the “fair use” system in Visual Crossing Weather”