

Downloading weather data for multiple locations in CSV, Excel, or JSON format is easy using our Query Builder page. In this guide, we will walk through the process of uploading a file of location or pasting in CSV data from the clipboard, composing a weather query, previewing weather data for these locations, and then downloading the result data for that query to our local computer for later analysis. To make this process extremely simple we will use the Guided Data Download functionality that walks us through the process step by step.
Before we get started, you will need an account on Visual Crossing Weather Data service. If you don’t already have one, you can get one for free. Simply follow our sign-up guide, and you can rejoin this guide in less than 5 minutes with your new account. In order to use the importing features described below you will need to either add a payment method to your account or else sign up for a monthly plan. Note that adding a payment method does not obligate you to pay for any service. You will only be billed if you exceed your daily free query limit. For more information on limits and monthly plans (which include this feature and many more), please visit our Editions Page.
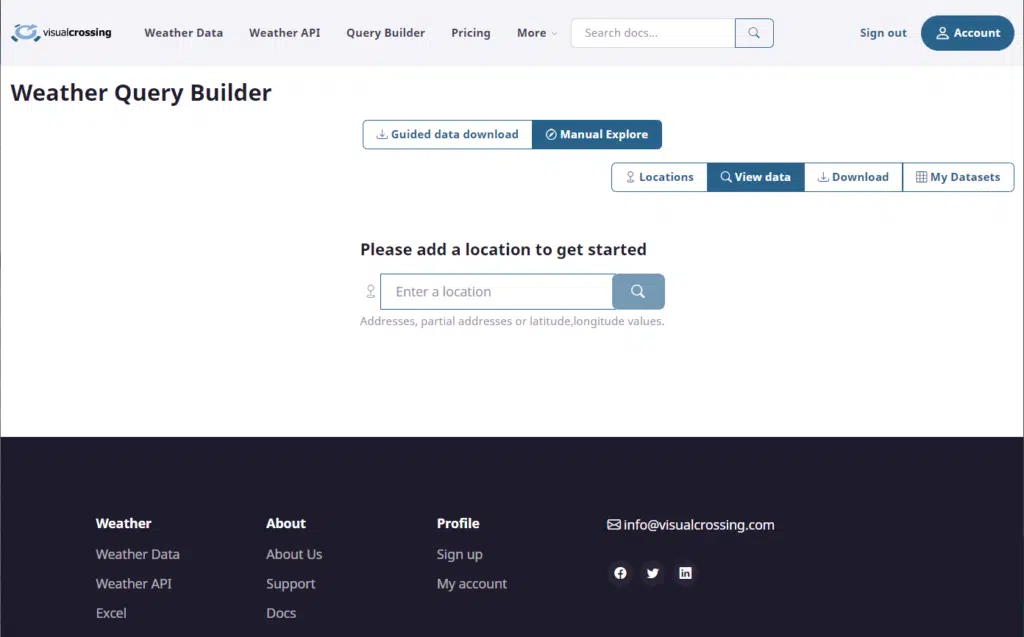
Once you have an account, please log into our Weather Query Builder. If you are logging in for the first time, you will see a page that looks like the one below. However, if you have used the Query Builder before you may see a grid of data based on the most recent query that you made there. In either case, you are now ready to load some locations, make a multiple location weather query, and then download that data to your local machine for further analysis.
Step 1 – Enter Guided Mode
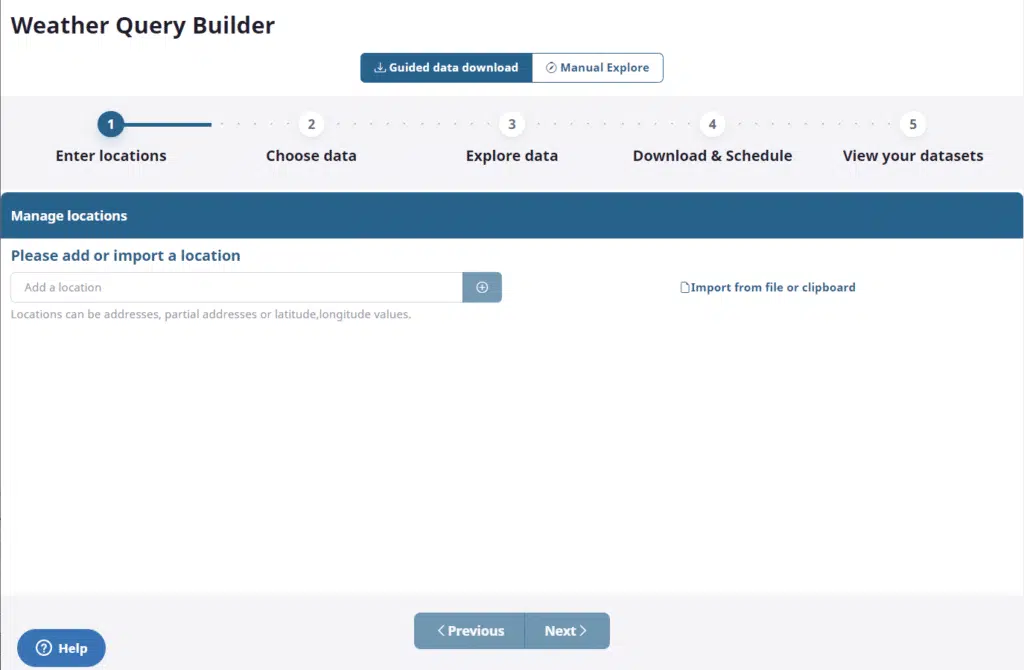
You enter Guided mode by clicking on the button labelled “Guided Data Download” near the top of the page. We will be using guided mode in this article. However, once you understand the process, you can use “Manual Explore” to do this same functionality and more.

When you first enter guided mode, you will be greeted by a screen that looks like the screenshot below. It is on this screen on which we will begin the data import.
Step 2 – Import Locations File
At this step you can choose to enter locations manually one at at a time, import a CSV file containing your locations, or paste in CSV data from your clipboard. Since multiple locations are best imported vs. being entered manually, we’ll select a CSV file on our computer containing our list of locations. To start the process click on the link to the right that says “Import from file of clipboard.”

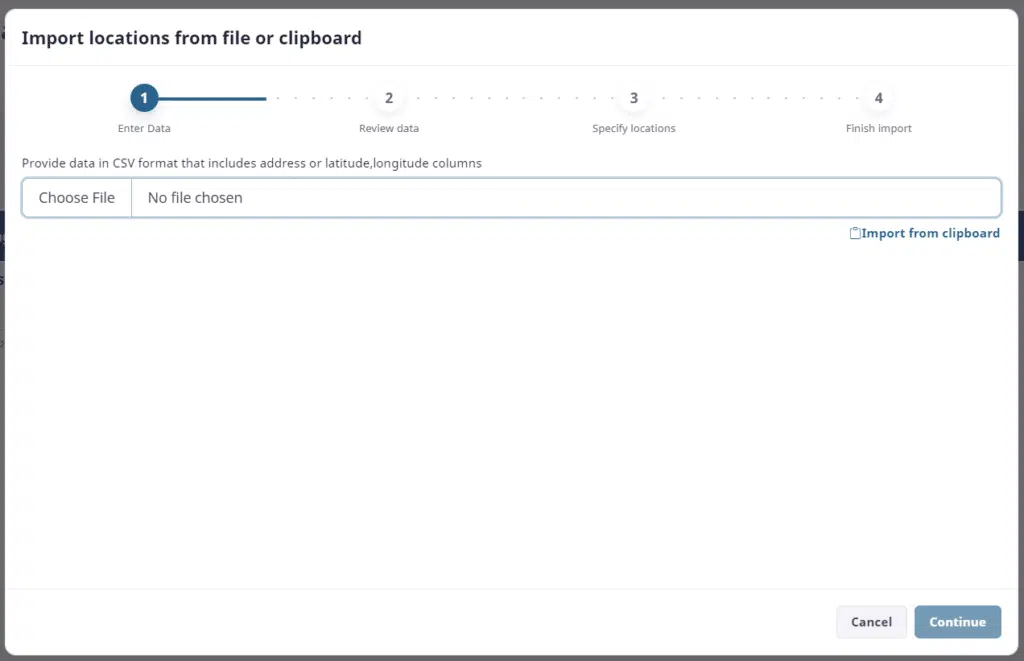
When you click this option, the import guide will open. The first step there is to click on the “Choose File” button on the left. This button will bring up a file chooser in which you can select your CSV locations file. Simply navigate in the chooser and select the appropriate locations file. Alternately, you choose the “Import from clipboard” link on the right if you want to paste in data. Note that if you choose this option, you will need to ensure that your clipboard data is comma separated. By default Excel pastes data in tab separated format, so it will not work directly.
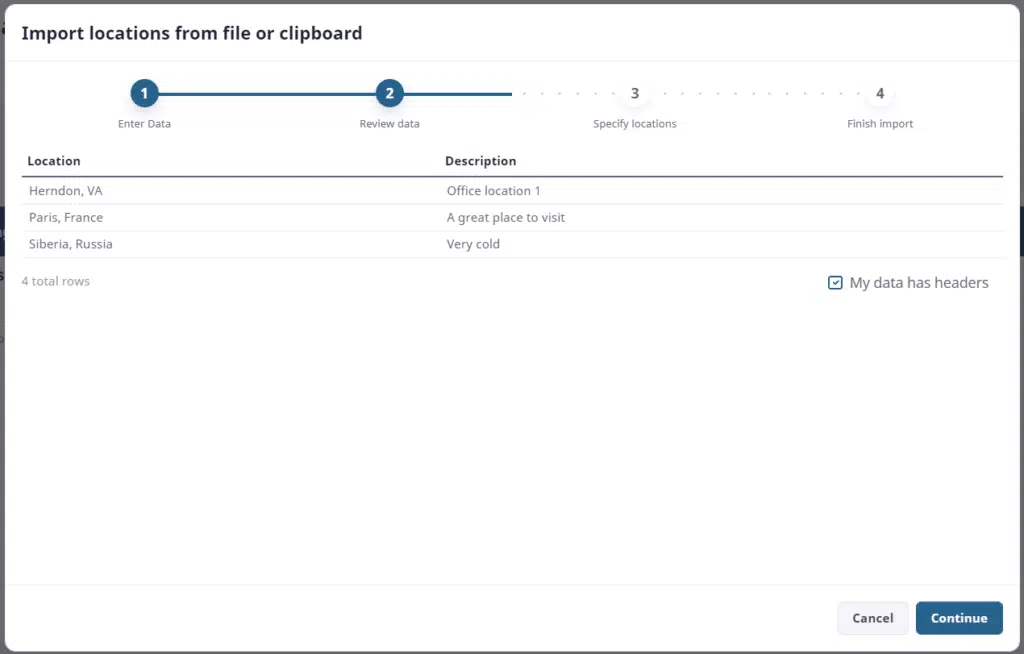
Once you have selected a file, you will be able to see the columns found and a sample of the data. Normally, your data will have headers and you can see them above the line at the top of the location data. In this case you can proceed directly to the next step by hitting Continue. However, if your data does not have headers, you will see the first location above the dark line. In this case, uncheck the “My data has headers” box on the right-hand side, and synthetic headers will be created for you.
Step 3 – Identify Locations
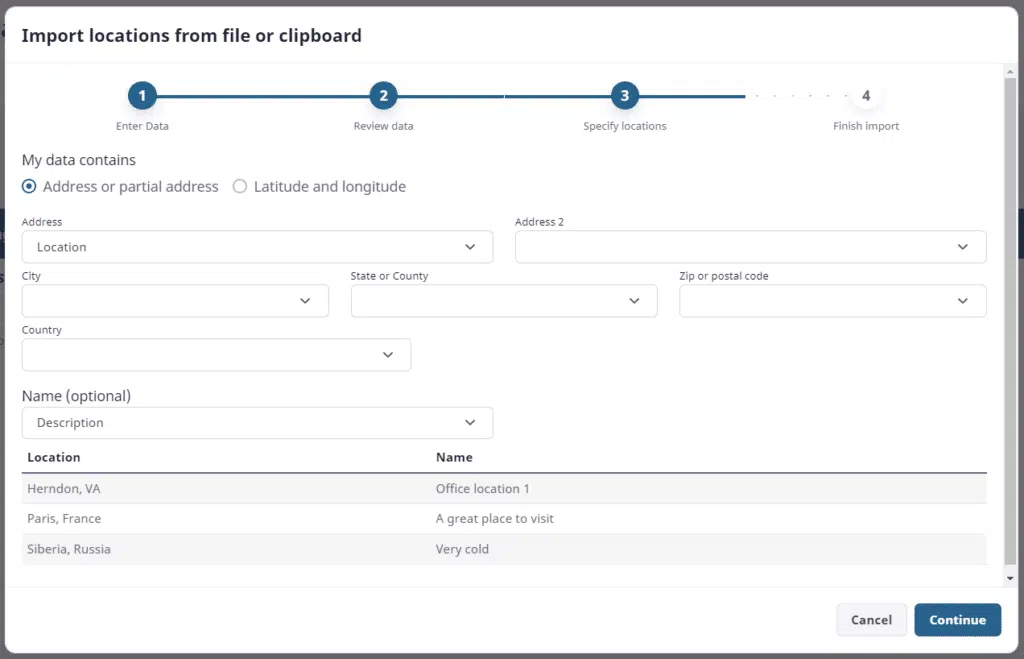
When you click Continue on the step above, you will now see fields defining a location above dropdowns that contain the headers from your location file. Simply use the dropdowns to select the columns in your data that match the location fields. At minimum you will need an address that can be geocoded or latitude and longitude values. However, if your input file has multiple columns that are required to compose a complete address, you can choose them all here. These addresses will then be geocoded by our server based on the data from your locations. If you have latitude and longitude values instead of addresses, simply change the radio button near the top to be “Latitude and Longitude” and then select the appropriate data fields in that mode. Note that if you need to include another input field in your output data on which to join business data or to make your results more human-readable, you may select that as the Name field.
In the sample below, I am using the single Location field from my input file as my Address and my Description field for the Name. Your selections in this screen will depend upon the format of your input data.
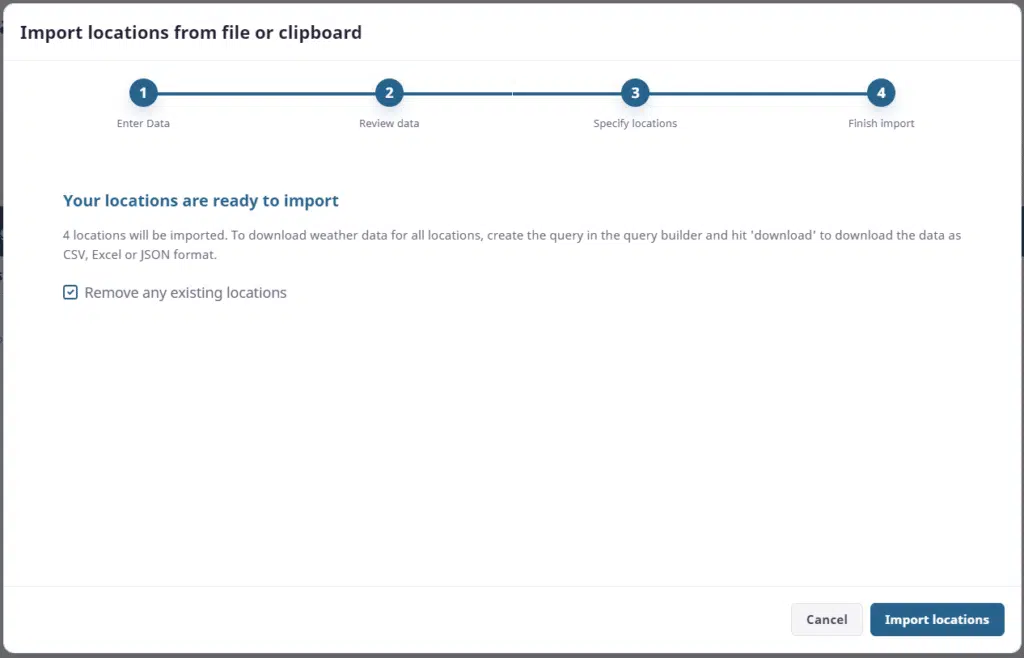
When you have made your selections, click Continue. The final step will tell you the number of locations as well as allow you the option to combine these new locations with any old locations that you may already have loaded. In nearly all cases, you will want the new locations to replace any old ones, so you should leave “Remove any existing locations” checked. When you are ready, click the “Import Locations” button to close the importer and return to the data download guide.
Step 4 – Choose Data
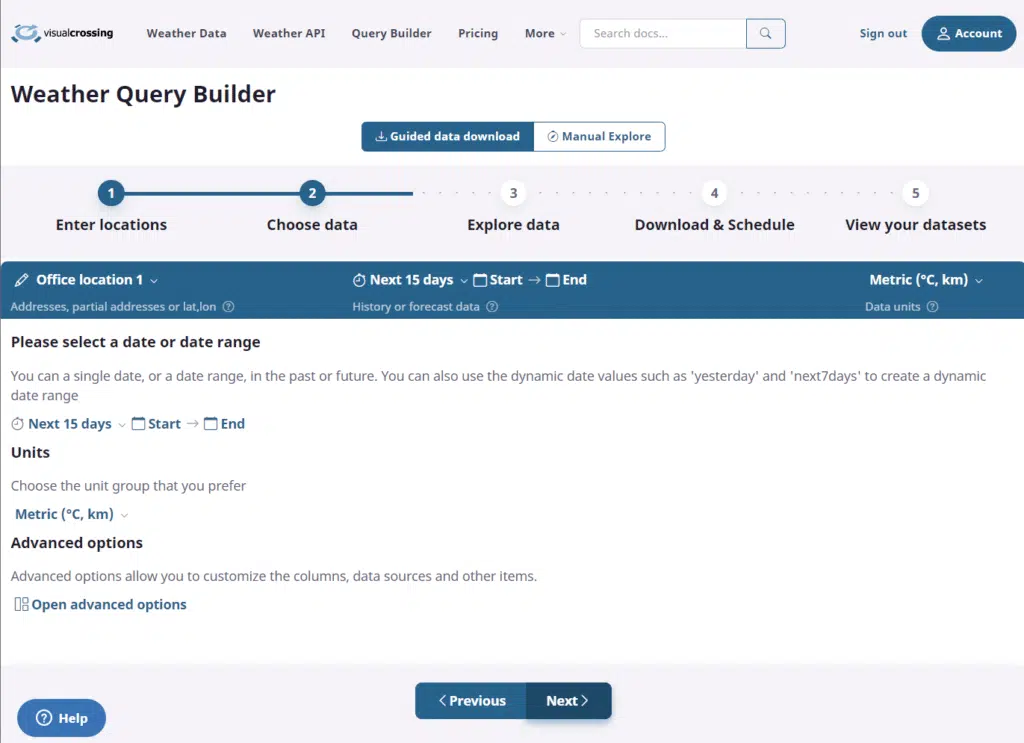
When the import helper closes, you will see a view of your imported locations. Note that in many cases you may have more locations than can fit in a single view. You can page through them to ensure that the loaded locations are as you expect them to be. When you are satisfied, hit Next to continue.

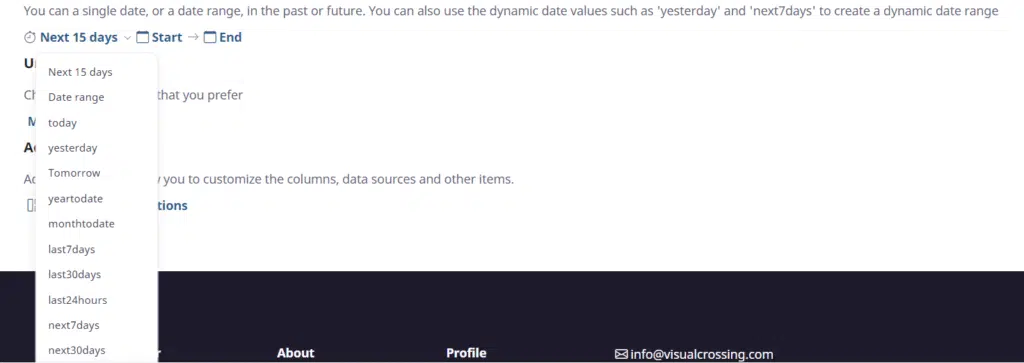
Now, we need to choose the date or date range and unit system for our query. For the date, you can either select one of the pre-configured date options supported by the weather engine or select your own date range manually. The benefit of selecting a pre-configured, dynamic option is that every time the query is run, the correct date range will be used. For example, if you select “Next 15 days” the Weather Engine will automatically return data for the next 15 days no matter when you run the query. If you run the query at the beginning of January, you will automatically get data for the first 15 days in January. If you run it at the beginning July, you will get data for the first 15 days in July, and this happens without any additional effort on your part. If you plan to run this query as a scheduled task (see below) or even more than once, using a dynamic date option can save you effort and avoid getting unexpected results. To learn more about dynamic time periods, you can read our article on this topic.
For the sake of simplicity, in this article we will use the default dynamic time period option for the “Next 15 days” forecast. However, you may choose any date range that you wish. If you do choose to select dates manually, simply click on the “Start” and “End” option in turn and a calendar control will pop up allowing you to select any date since 1970.
Also on this panel you choose the unit system that you want for your results data. In this article we’ll use Metric, but make sure that you select the desired units system to avoid unexpected results. Also there are advanced options available as well, but they are outside the scope of this article. When you are ready to move forward, press Next.
Step 5 – Preview Data
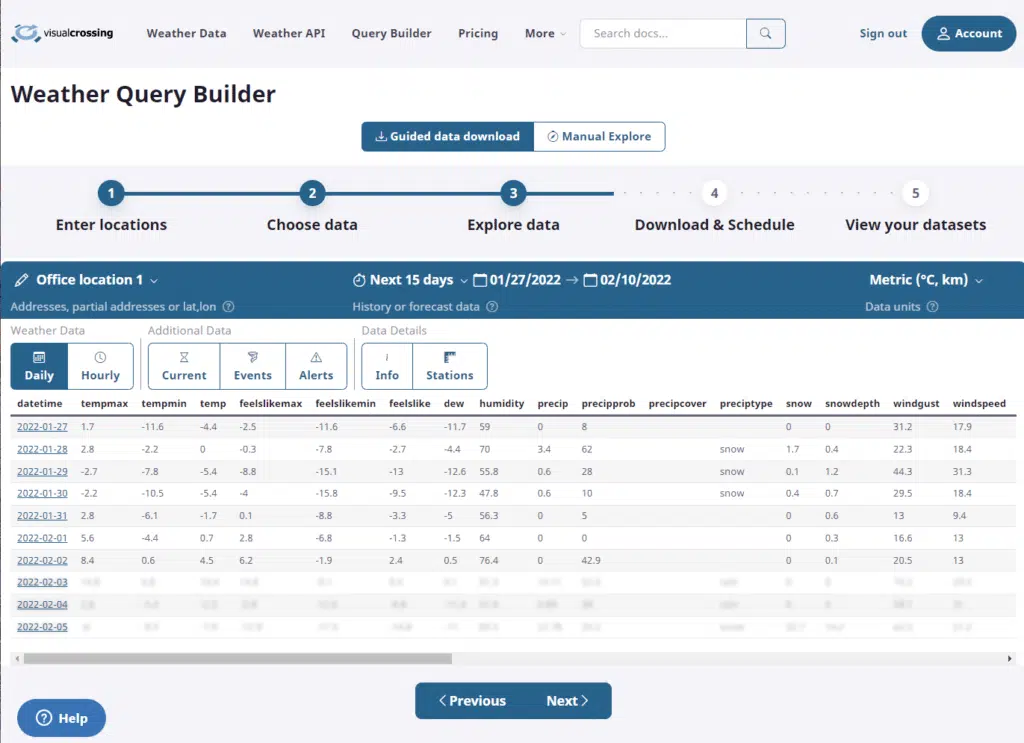
You should now see an interactive data grid such as the one shown below. In this view you can preview weather data results for your locations before committing to download the full dataset. While the details of how to use this view are outside the scope of this article, there are a few highlights of interest here. One is the upper left dropdown where you can select among your various locations. The grid will automatically update when you change selections. Centered in the blue bar above the grid is the date selector. If you selected a dynamic date option in the previous panel, it will be “expanded” here to show you the specific dates that will be queried based on the current date. You may change these dates manually here, but if you do, you will no longer have a dynamically updating date in your final query.
Above the grid you will see a toolbar that allow you to change the view from daily data to hourly as well as to other options such as current conditions and alerts. You can explore these options, but the grid itself will only show the first few rows of data as a preview. Which portions of this data will appear in your results are based on the output format that you select and the selections that you make in the next panel. If you are generating tabular results in CSV or Excel, you will only be able to query a single view of this data. Typically that view contains standard daily or hourly weather measures. However, if you are querying JSON results, you will be able to receive any or all of these views dependent upon your license level.
It is worth noting here that if you use Manual Explore model you can exchange this preview grid for a full view of your data. This is very useful for people who want to explore the data directly on the webpage and especially beneficial for people who have data plans so that they don’t need to be concerned about query limits and data charges. While doing so is outside the scope of this article, this is powerful functionality to remember for future use.
When you have finished previewing your data and are ready to download the full results, click Next to continue.
Step 6 – Run Query and Download Data
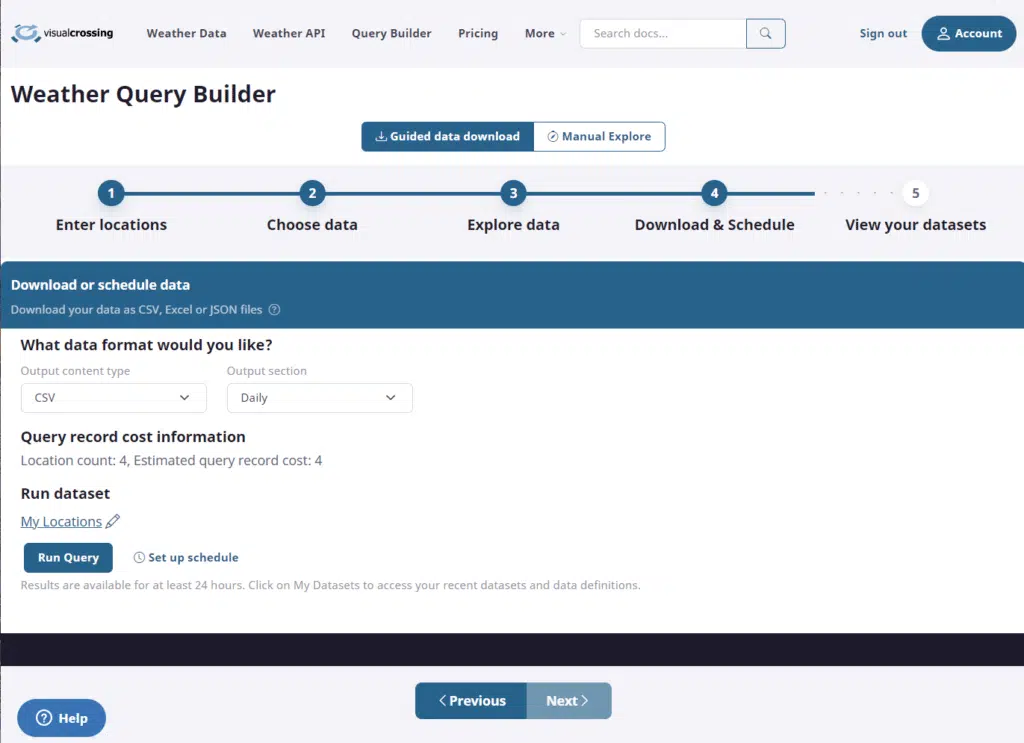
In this penultimate step you will actually submit the weather query to the Weather Engine for execution. Before you do this, you need to set the output format desired and the type of data that we want to retrieve. You do that with the dropdowns at the top of this section. In most case you will want CSV or Excel format. Both are easy to import into most data analysis tools. In this case for the output type you will generally want to select daily or hourly data depending on the temporal resolution of data that you need. If you instead select JSON output, you will be able to choose which sections appear in your output. JSON is a far more flexible output format but typically must be consumed by code. So, please verify that the tool that you wish to use with the result data can accept JSON before using this format.
In this view you can also set a name for this dataset. This is helpful if you want to schedule this query or simply run it manually in the future. By default the name will be based on the first location in the data. To change this simply click on the pencil icon and type a new name.
You will also see the estimate cost of the query. Note that a full, standard forecast counts as a single record while historical data and far future statistical forecasts count as one record for each row. For more information on how query cost is calculated, please see our article on optimizing your data usage.
The two main actions to consider on this panel are the “Run Query” and “Set up schedule” options. The “Run Query” option runs the data immediately against the query. This is the most common option and the one that will be use in this article. However, depending upon your plan level you may also be able to schedule your queries to run every day at a fixed time. This option can be very valuable allowing you to get fresh data results every morning, evening, or whenever weather data is important to you. You will be able to access this data via a custom link that you can then download directly or load into Excel or other tools. If you want to learn more about setting up and using a scheduled web query, please read our article “How to schedule weather data queries.”
For simplicity in this article we will use the “Run Query” option to run our weather query right now. Depending upon the number of locations and the date range selected, you will see a wait spinner for a few seconds, minutes or even longer. If you want for the query to complete, you will see a “Download” button appear. Clicking this button will download your data immediately to your local machine.
Below the “Download” button you will see custom links that can be used to download this data in a browser, directly into Excel, or for use with any tool that can fetch data from the web.
Note that you don’t need to wait on this page for the query to complete. You can press Next at any time to see the results and status in your saved datasets view. Your query will continue to run until completion.
If you have already downloaded you weather data results, you can stop at this point. However, it is useful to press Next one more time to see your new query on the datasets page. On this page you can download the results data again (or download them for the first time if the query was still running when you left the previous page.) You can also edit the query and run it again or schedule it for daily use.
Note that you can access this page at any time from the normal Query Builder view by clicking on the My Datasets option in the upper right.

When we you are finished with this final tab, click on the Finish button to return to the standard data explorer view.
Summary
In this article we have walked step-by-step through the entire process of loading a file of locations, composing a weather query using those locations, and then downloading the results of that weather query to a local file. Armed with that file you can analyze this data in nearly hundreds of different tools ranging from Excel to powerful business intelligence tools to custom in-house apps. You could load it into a database to find correlations with existing business data or to share the data with an entire enterprise. The options and use cases are limited only by your imagination.
Questions or need help?
If you have a question or need help, please post on our actively monitored forum for the fastest replies. You can also contact our Support Team.