

Dashboards are one of the most effective ways to communicate data to users. Originating, from the dashboard in cars and vehicles, data dashboards typically combine multiple data visualization elements such as charts, maps, grids and KPIs to provide users with a fast, concise, and clear way to interpret a set of data.

For businesses, organizations and even casual weather enthusiasts who want an easy-to-consume summary of weather data, the weather dashboard can be natural tool.
Why build a weather dashboard?
Dashboards are one of the best ways to accurately convey multiple pieces of data. Therefore, for any business or person who is somehow affected by the weather (and who isn’t?), a weather data dashboard is a natural fit.
Some industries are affected by the weather more than others. Industries such as energy production which rely on wind or the sun’s solar radiation, outdoor construction, agriculture plus many other businesses all need a reliable way to understand how the weather influenced past operations and how it will impact future activities. Retail operations that sell goods that are weather dependent, outdoor entertainment venues, even party and wedding event planning all need knowledge of how the weather and climate will impact them.
Each use case will create the need for different type of dashboard which displays different types of weather data. Some dashboards will combine weather data with additional business metrics such as historical retail sales. Others will focus solely on weather forecast data to help employees plan upcoming operations. Some of those operations will need information about a few elements of weather data; a wind power producer will naturally focus on wind strength and direction and be less interested in precipitation or temperature (although the events of Texas in Winter of 2021 may cause people to reconsider!)
There are many reasons to build a weather dashboard. While different users will need to focus on different aspects of weather data, there are many commonalities to the individual pieces that go into creating a dashboard. We will now discuss many of the frequent aspects of building a weather dashboard including what data is available, how to get the data and then how to use the data on a weather dashboard.
Types of weather data
There three main types of weather data that people need for dashboards – weather forecast data, historical weather observation data and climate summary data and ‘normals’. There is also a fourth type of data, the historical weather forecast data which represents forecasts from previous days.
Weather forecast data
Nearly of all of us already use a weather forecast dashboard in the form of an app on our phone, a weather web site or even a dashboard-like summary on the local TV weather forecast. These help us plan our own personal lives around the upcoming weather forecast.
Weather forecasts represents the weather that is predicated to happen over the coming days. It forms the basis of the typical operational weather dashboard that can be used to help plan for the upcoming weather. If you are an working in agriculture or farming, a weather forecast dashboard can help plan for the upcoming weather.
Do we need to irrigate our crops or will we hit a critical degree day threshold that requires us to apply pesticide or harvest?
Many weather dashboards that are primarily based on weather forecast data will also integrate either historical weather observation data or climate summary information to help us understand how the predicted weather differs from what we would normally experience.
Historical weather observation data
Weather observation data represent the data that happened in the past. These data are recorded by numerous weather stations around the world. Official stations are frequently located at airports or official weather service locations, but there are thousands of additional weather stations around operated by schools, local governments and even individuals all recording the weather observations.
Weather history data is typically used to understand how certain types of weather affected the operations of a business in the past.
How do cooler temperatures affect the attendance of an outdoor concert?”
Climate summaries and normals
When analyzing the weather forecast or recent historical weather observations, it’s sometimes useful to understand what ‘normally’ would happen -what are typical maximum and minimum temperatures, how likely is it to rain, will the wind generally be strong enough to power my wind turbine?
In addition to the normal weather that could be expected, it is also often important to know the weather extremes. Past extreme weather is a guide on how hot or cold it conceivably get, or what is the most rain or snow that we should plan for. Some locations have relatively consistent climates where the extremes do not vary a great deal, whereas other locations can have weather that varies significantly from year to year. Understanding how the weather was in the past is a critical foundation for future planning.
Historical weather forecast data
Weather data elements
Within each category of weather, there are numerous weather data elements representing all the aspects of what we call ‘weather’, including temperature, precipitation (rainfall, snow etc.), wind speeds. solar radiation and many more. For a full list of available weather data elements see our weather data reference.
A typical weather dashboard won’t try to present all the available weather data elements but instead highlight the data elements that are important for the dashboard consumers.
Retrieving weather data
Before we start building our dashboards, we need to find a reliable source of weather data. As we will find out as we start to create our dashboards, dashboards can typically be created using data from one of two ways.
Downloading weather data files
The first data source technique is to find a source of weather data files that can then be used in the dashboard. This data will need to be in a standard table format. The most common format for interchange is CSV (comma separated values) where the weather data values are simply separated by commas (hence the name):
datetime,tempmax,tempmin,precip
2021-09-28,78.8,58,0
2021-09-29,71,56,0
2021-09-30,70.1,52.1,0
2021-10-01,69,49.9,0
2021-10-02,72.9,53,0.2
2021-10-03,74,58,0.23
Other file formats exist, often simply exchanging the comma separator with another separator character. TSV (tab separated values) are one such example.
Many tools that support dashboard creation can import CSV formatted data such as Microsoft Excel and business intelligence tools such as PowerBI, Tableau, SAP and MicroStrategy. In addition, you can import files in CSV format directly into a database and then have the dashboarding infrastructure access the data in the database.
Downloading files is a great and simple way to get started. However the big disadvantage is that each file is a static snap shot of weather data. This may be fine for simple dashboards but if we want our dashboard to automatically update then we need to find a solution that can easily update the data automatically.
Using a Weather API to retrieve dynamic weather data
The typical solution to this problem is to use what’s called an API or “Application Programming Interface”. This API can be used to retrieve new weather data whenever it’s needed. For example, a dashboard based around the weather forecast may update every hour to retrieve the new weather forecast.
The most common example of an API to retrieve weather data is a web based “Weather API”. A web-based weather api is very similar to any web site you might access. Construct a web address just as you would any web page URL and the weather data will be returned in format that the dashboard tool can understand. Here’s an example of a typical weather API URL that retrieves the weather forecast for London, United Kingdom.
https://weather.visualcrossing.com/VisualCrossingWebServices/rest/services/timeline/London,UK?&key=YOUR_API_KEY&contentType=csv&include=days&elements=datetime,tempmax,tempmin,precipIn this article we are going to use the Visual Crossing Weather API, which provides easy access to all the types of weather data we are discussing here.
Weather APIs can typically return data in one or more data formats. In the case of the Visual Crossing API, one format is CSV, just as with the individual files above. In the above example, the weather forecast for London, United Kingdom is retrieved in CSV format.
Another common format is a format known as JSON (JavaScript Object Notation – see here for more technical details). Here’s the same London,UK forecast but in JSON format:
{
	"latitude": 51.5064,
	"longitude": -0.12721,
	"resolvedAddress": "London, England, United Kingdom",
	"address": "London,UK",
	"timezone": "Europe/London",
	"tzoffset": 1.0,
	"days": [
		{
			"datetime": "2021-09-29",
			"tempmax": 59.3,
			"tempmin": 48.6,
			"temp": 53.8,
			"precip": 0.04,
			"hours": [
				{
					"datetime": "00:00:00",
					"temp": 54.9,
					"precip": 0
				},
          ...
The JSON format appears to be more complex than the simple CSV table, but that additional sophistication provides some very interesting features. The main feature that JSON allows for is for the single weather data set to include more than just one simple table. If we look back at the CSV data, we can see we have one row of weather data for every day. The JSON data allows a lot more information.
For example, this data includes both the day-level data we saw in CSV and the hourly detailed weather data for each of those days. In addition, the JSON data includes information about the requested location (the latitude, longitude, time zone etc.). Finally, the JSON data can include the latest real-time weather conditions and also any weather alerts that may be occurring in that location such as flooding, storms or other emergencies. CSV datasets can support the same information, but each set needs to be a different request to the Weather API.
Another big advantage of JSON is that the format can convey what data type the data values being passed are (numbers, strings and boolean values for example), which can make it easier for the consuming dashboard technology to correctly interpret the data.
If your chosen dashboarding technology supports JSON formatted data, it’s worth considering using this format despite the initial complexity. The results may well be more complete and rewarding.
Signing up for the free Weather API
Before we continue, you may want to sign up for your own free Weather API account. This will allow you to down load your own weather data to your local machine so you can follow along with the examples.
Weather data aggregation
When we show weather data in a dashboard, we typically want to show a mix of weather elements such as temperature, wind, rainfall or snowfall amounts etc. Sometimes we will show them for a particular time (“What will the temperature be tomorrow at 5pm for the wedding I’m scheduling”). However, we often want to look at weather for several hours or days so we can see a summary of the weather for that period.
The most common example of this is the daily summary we might see in a weather forecast. In these cases, we need to summarize individual hourly weather observations or predications. How things are summarized, or ‘aggregated’ depends on the weather element being summarized.
Rainfall and snowfall are typically summarized as the total of the amount. For example, ‘we expect 25mm or 1 inch of rainfall today”. This does not make sense for temperature however – the total temperature for the day is meaningless. For temperature we typically present the maximum temperature, the minimum temperature and the average (normally the mean).
If you are creating dashboard within a tool such as business intelligence software application, you will need to select the appropriate aggregations for each weather element. Some common ones are:
Total and Sums – Rainfall, snowfall, amount of solar energy.
Minimum, maximums and averages – Temperature and feels like temperature, wind speeds, pressure, humidity.
Weather dashboard presentation elements
There are number of common visualization elements within a typical weather dashboard. The most common are the KPI, bar and line chart.
KPI (Key performance indicator)
The KPI is a single value which communicates critical information. In the case of our weather dashboards, the KPI will be used to summarize a small number of weather values that are critical to the dashboard user. KPIs are chosen because they are easy to digest so keeping the number of choices small can aid in the clarity of the view.
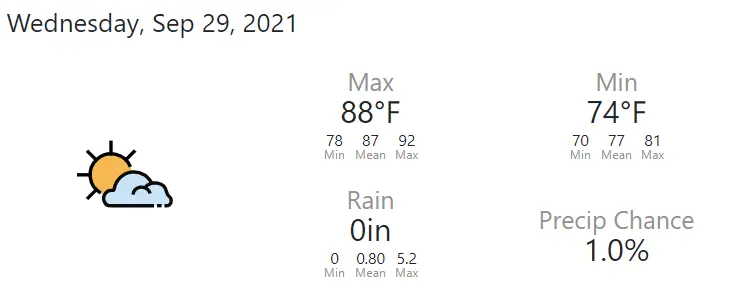
In the case of the historical weather dashboard, a simple row of KPIs is used to summarize the extremes of small number of weather elements:

In some cases, adding a small amount of additional information can help improve the user ability to interpret the information. In the follow case, we have added normals to the KPI values. The user can quickly see that the predicted high temperature for this day is 88F (about 31C). They can also see that this falls close to the normal, average temperature for this date of 87F. Historically the high temperature has ranged from 78F to 92F.
KPIs can also show changes rather than absolute values. This can be useful to users whose activities are affected by changes in weather.
Bar charts
There are many data visualizations to choose from in today’s dashboarding world however the bar chart remains one of the most effective to communicate some of the core weather data elements. A variation on the stacked bar chart can be used to communicate the actual daily temperature range compared to the normal and historical extremes:
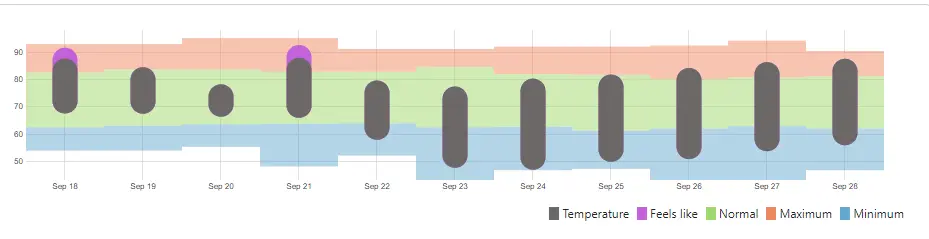
In this example, the dark bars highlight the actual temperature ranges for the days ranging from the minimum to the maximum temperature for each day. The dark bars alone communicate the changing daily temperatures extremely effectivly.
The chart is also able to convey to the consumer how the temperature compares to the historical temperature. The green color shows the typical range of minimum to maximum temperatures. The orange extends the range to the extreme high temperature and the blue the extreme cold.
From the above chart, we can see that the temperature in this date range initially started warm then cooled down (with overnight lows that approached some of the historical low temperatures). After the midpoint, the daytime temperatures warmed up to slightly above normal.
Putting it all together
Once you have found a reliable source of weather data. Putting together a weather data dashboard is not hard. With the above techniques to process the data, you can build a dashboard to retrieve weather data quickly and reliably. This will then enable the dashboard users to analyze weather trends alongside existing business or internal data to identify patterns. From historical weather data trends, the dashboards can be used with weather forecast data to plan upcoming activities.
Questions or need help?
If you have a question or need help, please post on our actively monitored forum for the fastest replies. You can also contact our Support Team.