

Occasionally when reviewing weather data you come across a weather record that simply doesn’t seem right. Perhaps the precipitation is too high based on what you know about the location or perhaps the temperature is too low, and you know because you live there. At other times you may find missing data within your weather records and wonder the cause.
There are usually a good explanation either natural and technical for any of these situations, and while our goal is to have the best weather data in the industry there are sometimes imperfections in the feeds provided by our suppliers. If you believe that you are seeing this situation please read on so that you know how to properly submit a data inquiry to our support team.
This article is your primary source regarding how to categorize potential bad data issues and how to report them to the Visual Crossing data team so that we can give you a useful response and make any necessary corrections to our data feed.
Types of potential data problems
Data quality questions come in several varieties. The primary categories are as follows:
- One or more weather metrics are out of the expected range
- Data that appears to be incorrect based on your personal knowledge or observations
- Results that are missing a small number of expected weather elements
- Results that are missing one or more weather measures entirely while other measures appear as expected
- Results that are simply different than other weather web sites
Weather element(s) out of range based on normal conditions
This is the category any time one or more weather elements appear to be abnormal for the location being queried. Before you jump to the conclusion that there is a data error, however, you must consider natural weather extremes that may occur.
For example, a hurricane can pass slowly and drop a large amount of rain, perhaps even portion of an area’s expected annual rainfall over just a few days. This would appear has a major spike in the precipitation data and appear to be an error. Also, extreme heatwaves, cold snaps, and snow storms happen in areas all around the world.
In northern Virginia, USA, at the headquarters of Visual Crossing, we tend to get a relatively modest amount of snow and it rarely occurs outside the range of December to February. However, if you look at weather history, a freak snow storm hit in early October 1979 dropping between 6 and 12 inches of unexpected snow in the region. While this event predates the experience of many people reading this article, it is not only possible but is well documented. Hence, it cannot be discounted.
If you are considering a similar example that appears to be outside normal bounds for a location, one important step is to check other sources of historical information and see if there is a natural explanation. For example, Wikipedia is a great source of historical overviews for hurricanes and other major weather phenomena. Another option is to Google search on the date and region name, date and nearby large city name, or date and the type of weather event that could explain your data anomaly (hurricane, heat wave, etc.).
If you are unable to find a natural explanation, it is possible that the data itself is wrong based on an historical weather station error or the transmission of the data into our database. In this case, please let us know about the issue so that we can research it and correct it if possible. Please, collect and data outlined in the Reporting a Potential Weather Data Error section below, and send all of this data to our support team. We’ll will research this situation and find an explanation.
Data that is incorrect based on your personal knowledge
Other times you believe that specific weather records are incorrect based on your own personal knowledge. Perhaps you live in the query location, and you are certain that there was no rain at your location on a given day or you know for a fact that the overnight low in your backyard was significantly cooler than our data feed reported.
The most common cause for this type of data question is due to weather station placement. Most people don’t have a major weather reporting station in their backyard, so our system must combine data from the closest stations to find the best approximation of of the conditions at a given location.
While we use state-of-the-art interpolations between weather station in when reporting our data, there is often some minor difference between the exact weather at a given point verses that reported. This is quite simply because there is frequently no weather reporting station at any given query point. Error margin can get worse as your location gets farther from reporting stations. In certain areas this is an even more important factor due to significant weather differential based on altitude variations, nearby bodies of water, and urban landscapes.
To determine what weather stations are being used to supply the data for your query, simply turn on our weather station details feature. You can do this by looking at the Stations tab in our Query Builder interface. Another option us to use our Historical Weather Dashboard which shows a map of the queried location along with the nearby weather reporting stations as points. This will help you understand where stations are located in relation to your query location.
Consider the position of the stations relative to the query location and how differences in elevation, proximity to water, and other factors may make their reports different then the observation at the target location.
If you are convinced that station location differences and other geographic factors do not explain the unexpected results, then let us know, and we’ll research further. Please, collect all of the data outlined in the Reporting a Potential Weather Data Error section below, and send it to our support team.
Results that are missing elements
Small time gaps in result data are most often caused by weather stations temporarily going offline. This can happen for maintenance or any number of other technical reasons. In more cases, our weather engine can find alternate stations nearby to fill in the missing data. However, in some cases there are not enough nearby stations within a reasonable search radius. In this case, the weather engine cannot find complete data to fill the request and thus no data is reported.
Typically, the best work around for this issue is to expand the station search area. You can do so easily using our weather station details feature. This article will explain how to expand the station search distance within our Query Builder interface. Additionally, these same settings are also available in our Weather API.
If you need more information or are seeing a problem that cannot be explained or solved by increasing the search distance, please contact our support team with including all of the details mentioned in the Reporting a Potential Weather Data Error section below. We can then look into the issue further.
Results that are missing specific weather measures
It is not unusual to see weather records that are missing certain weather measures. Often this is completely normal and due to the actual weather conditions. For example, if it is not cold and breezy, a Wind Chill metric will not be reported. This is because Wind Chill is only defined in certain conditions.
In other cases, normal weather measures that you seek may be missing from the results. This can typically be explained due to the closest station(s) not reporting the measure in question. For example, every weather station reports temperature. Temperature is easy to measure with relative cheap instrumentation. However, measuring cloud cover and visibility require more expensive and complex technology. Even a seemingly simple weather measure such as snow, can be difficult to measure properly. Thus, large stations such as those at major airports and government installations tend to report more weather measures than smaller stations such as those at local airports and schools.
One way to work around this issue is to expand the number of stations considered by the weather engine and also expand the station search area. When more stations are considered, farther stations can fill in the gaps for closer stations that do not report specific measures. This article explains how to change the number of stations and the search radius in our Query Builder. You can also change these parameters via our Weather API.
If you need more information on how to get coverage for specific weather measures in specific locations, please send a request to our support team. Make sure to include all of the details requested in the Reporting a Potential Weather Data Error section below.
Results that are different than other weather web sites
Weather data from other web sites cannot always be compared directly to Visual Crossing results due to different techniques used reporting and displaying data.
When comparing data with other sites, the first step is to ensure that the requested location is being interpreted as the exact same place. This is particularly important for addresses and partial addresses which may be mapped to different co-ordinates due to minor variations in geocoding techniques. Also, some historical data web sites do not offer any form of interpolation and instead “snap” historical data requests to a specific weather station. This can easily happen without the user even being aware of the switch. In this case, you can bypass our weather engine’s interpolation functionality and request data from a specific weather station for comparison.
Another issue is that some other weather web sites use a different definition of a day. The day definition used by Visual Crossing data represents the calendar day from midnight to midnight in the local time zone of the location. Some other websites use a morning to morning day (eg 6am to 6am). The most common impact of this different definition is that the low temperature reading is delayed until the following calendar day compared to Visual Crossing. This is because the low temperature typically occurs just before sunrise. Similarly some web sites highlight precipitation during the day time hours only whereas Visual Crossing reports rain at any time of the day. Where possible it is recommended that you compare weather records at the hourly level rather than the daily level to ensure a valid “like for like” comparison. Even in this case, however, you will need to make sure that the comparison website is reporting data in local time at the location vs. some other standard such as GTM. If they are not reporting in local time or not accounting for local daylight saving time changes, you will need to convert their output before you can conduct a valid comparison.
For forecast data Visual Crossing uses industry leading forecast models including those from NOAA, DWD and others. Other websites may use different forecast models and so may show slightly different forecasts based on different model results. It is normal for forecasts for vary somewhat amongst weather models and reporting systems just as they do amongst local TV meteorologists. To learn more about the weather sources that are used by Visual Crossing, please check our attribution page, and compare it to the comparison website.
If you see data differences that cannot be explained by the above options, please report them to our Visual Crossing support team. Make sure to include all of the details requested in the Reporting a Potential Weather Data Error section below.
Reporting a Potential Weather Data Error
The more information that we have about the details of your weather query, the more quickly and better we can asses the core reason and help explain that to you. Since we love to answer weather data questions, our worst support queries are ones that mention a problem but don’t give us enough information to understand or reproduce it. For this reason, we ask that you please submit all of the following details when asking our support team to research data issues or potentially errant weather results.
- The specific reason that you think the data may be in error
- The specific location(s) showing the problem (Make sure the include the exact address if that is part of your query. Otherwise, include the latitude/longitude point values.)
- A sample of the result table (specific weather records) that shows the problem
- The result date(s) for when you see the problem in the data
- The exact start and end date (and time, if appropriate) of your query
- The time that you ran the query and receive the questionable data. (This can be important for forecast data.)
- The method that you used to run the query – web query UI, API, Excel, etc.
- If you use our Query Builder to run the query, please follow these steps
- To obtain this log into the Query Builder using your Visual Crossing Weahter account.
- Next compose your query via the interface. You should limit the query to the specific location(s) and dates or times show the problem.
- Run the query and check the results. Do they show the error that you expected? If not, carefully compare your original query showing the error to the current one in the UI.
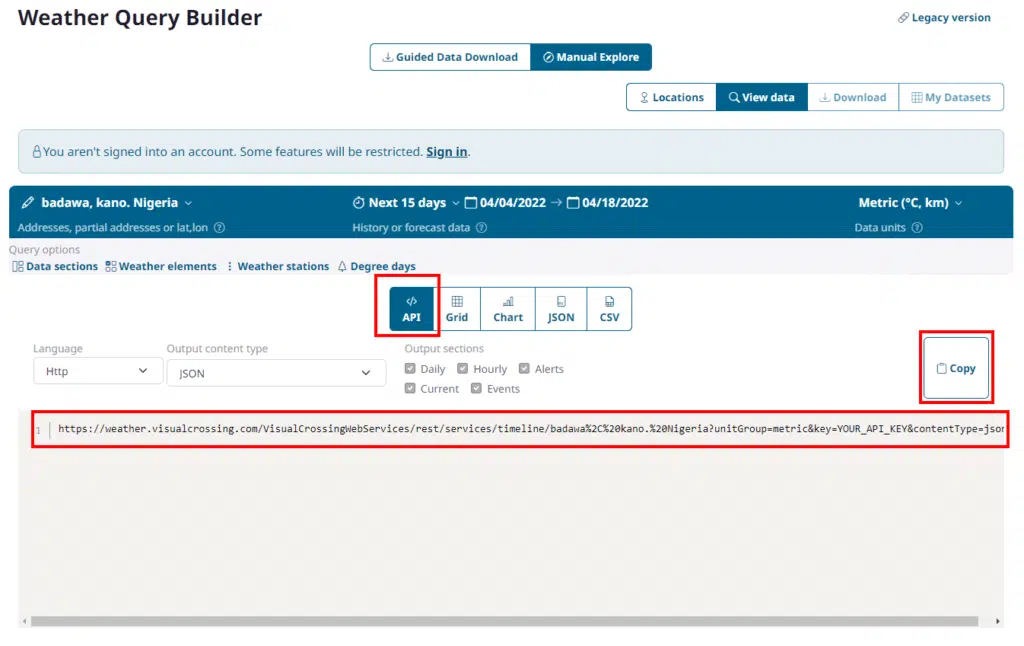
- Click on the Query API button above the query results. This will open the query window shown below.
- Copy the query URL from the Base Query text box.
Please send all of this data to our Support Team. This information will allow us to more quickly and easily understand and reproduce the exact problem that you are seeing. Our weather experts will analyze the raw data along with the data sources to find an explanation for the issue. Please note that this effort may take some time, and we will get back to you as soon as possible with our findings.