

Visual Crossing combines multiple nearby weather reports into a single hourly report. This is done through interpolation which is a powerful feature of the Visual Crossing system for locations that are not near a major reporting station, or where the geography is such that it can create temperatures changes in a short distance. This feature is necessary for all locations where the requested location is better served by multiple weather stations. By interpolating nearby weather station values, the resulting weather observation ensures that the Visual Crossing data will be as accurate as possible.
Historical weather data originates from individual weather stations that are located throughout the world. These stations can be official weather stations such as government meteorological organizations like NOAA in the United States, DWD in the Germany or JMA in Japan.
These weather observations are collected in real time at fixed intervals. For example in the United States, most weather stations collect information at least every hour and often as frequently as every five or ten minutes. Other areas of the world collect data at different intervals, typically at least every three hours.
However these observations are not always immediately available to electronic systems such as the Visual Crossing Weather Data store. In addition, weather stations will sometimes modify existing observation reports as a consequence of subsequent error checking and correction.
Typical weather station report evolution
Visual Crossing obtains historical weather data from multiple sources. These sources update weather data at different intervals which can result in different update intervals in the output. For example weather stations that report data via the MADIS data assimilation data network will often report their data within 15-30 minutes of the observation being recorded. However stations that only report via other data networks, such as the Integrated Surface Database (ISD), will not be available for one to three days. Other weather data source networks update at differing intervals ranging from minutes to one or two days.
For many areas, the stations that are used for a location are sourced from multiple different data source networks. As different station networks report with different intervals, this can result in the data reported by Visual Crossing changing as the weather reports become available in the hours and days following the actual weather station observation being made.
If the location requested is more remote, or does not have stations from multiple weather observation networks available, then the data availability will be constrained to the availability of that network. For example, if the data is only available from a station within the ISD network, there maybe a delay of one to three days before data is available for that location.
After three days, the initial weather station observations are generally available in the database.
Weather observation quality control and data verification
Weather station observations are subject to quality control checks at multiple intervals along the data assimilation cycle. This can result in existing weather station data being modified in the weeks after the initial observations are reported.
After the weather station has collected a report, the station itself will ensure that the sensors are calibrated correctly and that any observations made by that station are correct. If subsequent calibration identifies a problem with the sensors, then existing observations may be modified to correct the data.
In addition to individual station quality checks, multiple stations can be used to verify data consistency. Weather observation collection networks and the data assimilation providers have access to multiple weather station data. This allows for the providers to be able to create statistical error checks and data validation between stations.
For example, a network can check that the temperature reported by two weather stations that are 30km (about 19 miles) apart are consistent. If one station reports 30C (86F) and the other reports 28C (82F), then the data is reasonable. However if the second station reports a temperature of 10C (50F), then it is highly likely that one of the stations is reporting incorrect data. This data will then be corrected or omitted.
Finally, weather stations sometimes correctly collect data but are unable to transmit it to the central databases or data assimilation networks due to technical problems. This data will be made available when the problems are resolved.
After two to three months, the quality checks are generally complete and technical transmission problems are resolved. At this point, the data will not change significantly. However if our data providers do change the data after this period, we will also update our databases to reflect the updated information.
Viewing the stations that are used for an observation.
You can add the source weather station information to any historical weather data set. If you are using the Timeline Weather API, weather station information is included by default as part of the JSON.
You can also view the stations on a map in the weather data query tool or our history dashboard.
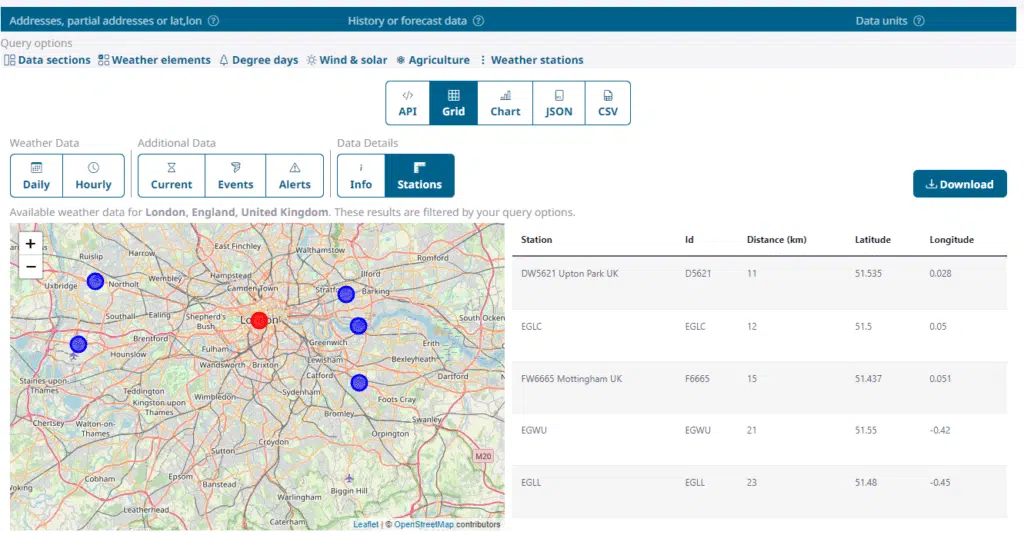
For example the following is returned for a request near Herndon in Virginia, USA:
WASHINGTON DULLES INTERNATIONAL AP, (Id=72403093738,7.1mi, 100%),
LEESBURG EXECUTIVE AIRPORT, (Id=72405503714,8.7mi, 40%),
GAITHERSBURG MONTGOMERY COUNTY AIR PARK, (Id=72033493764,16.0mi, 11%)
This includes the details of the station, the station ID and the distance to the station.
Note that weather forecast data does not use weather stations and so will not report weather station information.
Questions or need help?
If you have a question or need help, please post on our actively monitored forum for the fastest replies. You can also contact our Support Team.