

Historical wind data is a common weather measure that is very important for many applications including business and personal planning. Whether you are looking for wind data related to a specific storm, trying to evaluate wind damage for an insurance claim, or planning asset placement based on typical wind speed and direction, a weather data service such as Visual Crossing Weather provides wind data quickly and easily using global historical reports going back to 1970.
What wind measures are available?
Wind data is typically composed of three values, and they are Wind Speed, Wind Direction, and Wind Gust. In the case of an hourly weather record, the wind speed measure reports the average wind speed over the past two-minute time window immediately before the report. In the case of a daily weather record, wind speed reports the maximum of those hourly records throughout the day. Wind direction is closely related to wind speed. Wind direction reports the average direction of the wind during the wind speed reports.
Wind gust is another important weather measure, but it is reported only when the very short-term wind speed exceeds the reported 2-minute wind speed by more than 10 knots (11mph or 18kph). The “very short-term” period is typically defined as about 20 seconds. So, if there is a 20 second period where the wind is blowing more than 10 knots above the normally reported wind speed, this short-term wind speed is reported as a gust.
Standard wind speed is reported at 10 meters (33 feet) above the ground and recorded with an anemometer in an open area.
What are the units and range for historical wind data?
Winds speeds are reported in miles per hour (mph) or kilometers per hour (kph) depending upon the unit system that you select. Wind direction is always reported in degrees from north with north being 0 and south being 180. As for range, normal wind speeds average from 10 to 30mph in the US. Hurricane winds start at 74mph and and go up to over 150mph. The highest wind speed ever recorded on Earth was 253 miles per hour (408kmh) and due to a a tropical cyclone named Olivia. Luckily it was reported not by a human but by an unmanned weather station on Barrow Island off the coast of Australia.
How can I find wind data for a specific location and date (or date range)?
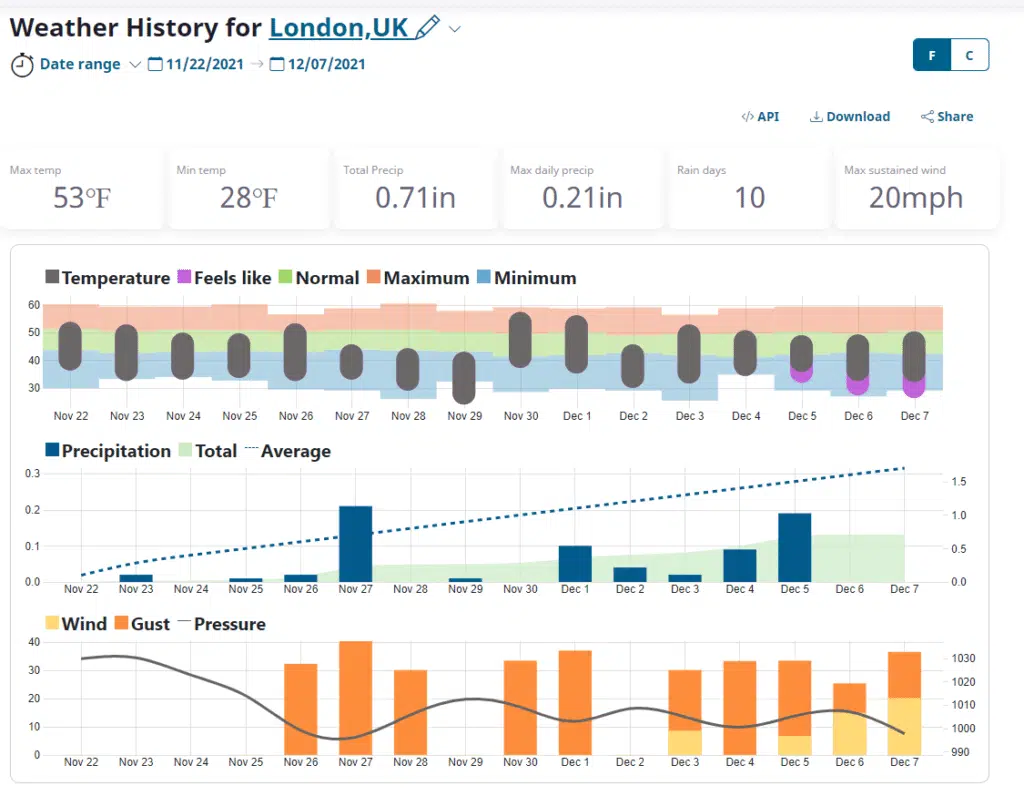
Visual Crossing Weather offers several ways to find the wind measures for a specific location and date. The easiest option is to use the free Weather History dashboard. Simply enter the location and date (or date range) of interest, and you will be able to see a dashboard page showing the weather details that you requested. The wind information is in the KPIs at the top and in the graph in the middle of the dashboard.
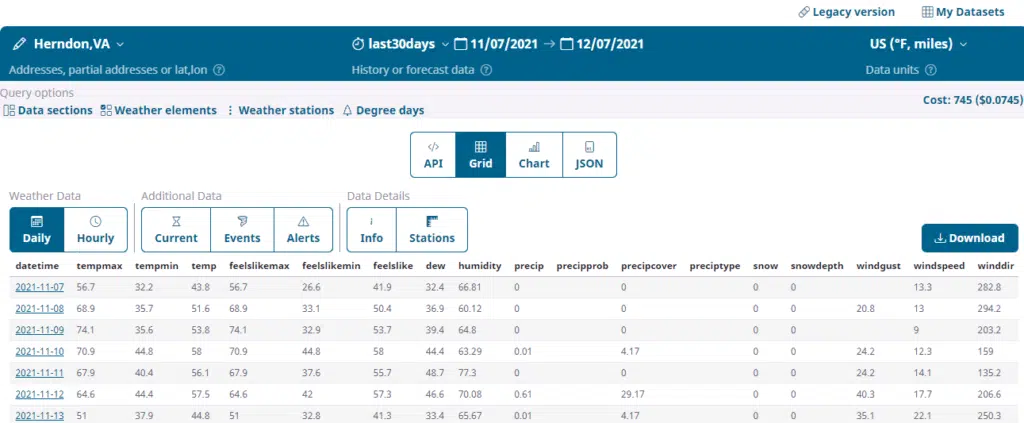
The second option is to use Visual Crossing Weather’s web-based query builder to get the weather details to analyze separately. This is a great option if you would like to download the wind data as a CSV file or as an XSLX for loading directly into Excel. First, sign up for a free account on Visual Crossing Weather if you don’t already have one. You can then enter your location(s) of interest, select the date range, and submit your historical weather query. After the query has been processed you can view the results directly on the webpage or download the results for further analysis.
The third option to obtain wind data is to run a query via the Visual Crossing Weather API. Using an API allows you to run your query from inside any script or code automatically. The Visual Crossing Weather API uses a simple query URL to define a weather query. You can run this URL in a command-line tool such cURL, in your own script or code, or even directly in a web browser. The query returns the weather results including wind data in CSV or JSON format. CSV results are easily loaded into a database or data science tool while JSON is a format that is easily parsed in languages such as Python and Java. If you follow our how-to guide, you can learn how to run your first weather API query in just a few minutes.
How do I find historical reports of wind damage, tornadoes and other past wind events?
The Timeline Weather API includes storm event tracking so that you can easily find the time and location of wind and tornado damage near a search location. The wind reports typically include the type of damage, a short description, the location (as a latitude and longitude) plus the date and time of the event:
wind,A FEW TREES DOWN IN THE TYSONS/VIENNA AREA INCLUDING NEAR VA-267 DULLES TOLL ROAD AND VA-123 DOLLEY MADISON BOULEVARD. (LWX),2020-06-09T20:00:00,10.3,38.93,-77.2
Read more how to retrieve weather events and storm reports from the Timeline Weather API.
Summary
Wind is an historical weather measure that is useful for many purposes including insurance, event planning, and asset management. Using Visual Crossing Weather, it is easy to find historical wind data for any worldwide location in several convenient ways. From the free Historical Weather Dashboard, to the weather query page, to a fully embeddable weather API for your code, Visual Crossing weather makes finding wind data simple.
If you would like to learn more about wind in Visual Crossing Weather, you can read more in our data documentation.
Questions or need help?
If you have a question or need help, please post on our actively monitored forum for the fastest replies. You can also contact our Support Team.