

Historical heat index and wind chill data are very important “feels like” weather measures for use in measuring the comfort level of people and animals outdoors. Whether you are using these metrics to plan events, predict attendance levels, or plan heating and cooling for large groups or your personal outdoor activities, a weather data service such as Visual Crossing Weather can provide heat index and wind chill data easily using global historical reports going back to 1970.
How are heat index and wind chill data used?
The two key measures, Heat Index and Wind Chill, are related in their ability to measure how the body perceives a given temperature. Heat Index is a calculation that combines both temperature and humidity. From your own everyday activities you already know that high humidity leads summertime heat feeling especially uncomfortable. People often talk about high humidity coupled with high temperature feeling “oppressive” and “unbearable.” One author even equated the combination to being wrapped in wet cotton balls that are the temperature of a hot bath. However, the same temperature combined with less humidity would feel much more acceptable. Heat index is reported as a number that higher than the temperature alone.
Wind Chill is essentially the mirror of heat index for cold temperatures. However, instead of humidity being the major additional factor in the comfortable level, the culprit weather measure is wind. The wind chill calculation combines temperature and wind speed to estimate how the body “feels” in the current conditions. Wind chill is reported as a number that is lower than the temperature alone.
What are the units and range for historical heat index and wind chill?
Heat index values are reported as degrees in the units system selected for the query. This means Fahrenheit for the standard system and Celsius for metric. Due to the nature of the heat index calculation and how the humidity value is “added” to the temperature, heat index is typically considered valid only for temperatures above 80 F (27 C) and relative humidity above 40%. In conditions with lower temperature and humidity, the “additive” value for the humidity is calculated as a negative value. Since this would suggest that the air temperature “feels” colder than the base temperature due to humidity, the heat index value is considered invalid an typically left empty in reported weather data.
Heat index values are typically considered in a set of risk bands for those engaged in outdoor activity. Heat index values above 91 F (33 C) are considered as “extreme caution” values, values above 103 F (39 C) are considered “danger” values and values above 125 F (52 C) are considered “extreme danger” values. As for the maximum heat index value recorded, it was 172 F (78 C) in Dhahran, Saudi Arabia in July 2003
Wind chill is also reported as degrees in the units system selected for the query. Thus you get Fahrenheit in the standard system and Celsius in metric. Just like with heat index, temperature is the core measure for this weather value, and then it is augmented by another weather measure. In this case that additional weather measure is wind. This makes sense to anyone who has been outside on a cold day where the wind blows sometimes and not others. Wind can make a cold temperature feel unbearable while the same temperature without wind is far more tolerable. Instead of being an additive value to the temperature as humidity is with heat index, wind is subtracted in the wind chill equation. This results in the wind chill value being lower than the base temperature. Because of the nature of the calculation, wind chill values are generally considered invalid for temperatures above 40 F (4 C). Also, the calculation typically considers a low wind value to be 3 mph (5 kph). This helps to account for the fact that the wind speed is rarely zero despite the fact that standard anemometers struggle to measure wind speeds at low speeds.
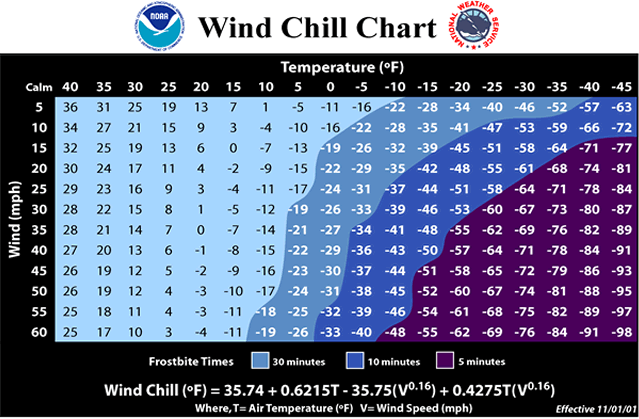
Wind chill is typically banded into “frostbite risk” ranges. Wind chill conditions from 36 F to -17 F are generally considered low risk. Below that, a chart is best to help understand the exact risk level. Note that for frostbite risk, wind is a stronger factor than temperature. Also note that different weather services have slightly different rules for both wind chill and heat index. Below is the US National Weather Service chart.
How can I find heat index and wind chill data for a specific location and date (or date range)?
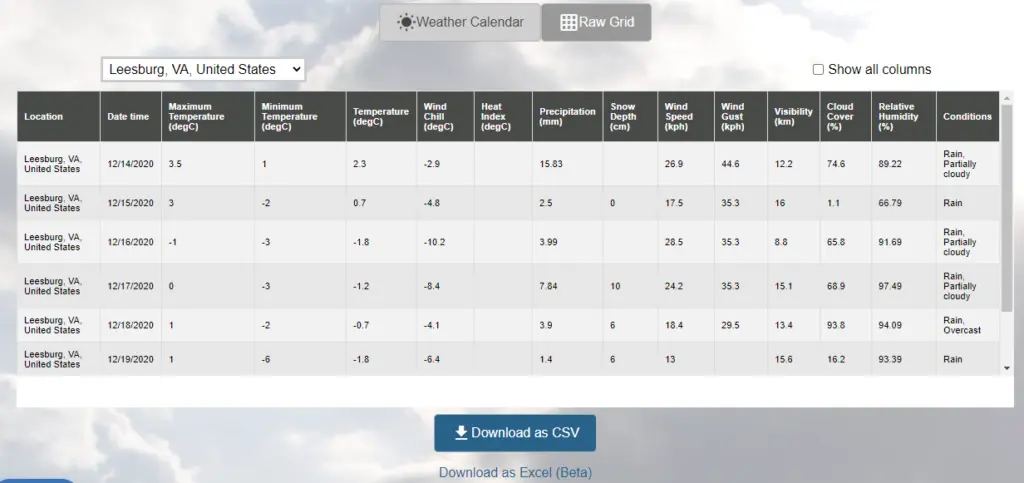
Visual Crossing Weather offers multiple ways to find the “feels like” measures of heat index and wind chill for a specific location and date. One easy option is to use the Visual Crossing Weather query page to get the weather details. This is a great option if you would like to download the “feels like” data as a CSV file or as an XSLX for loading directly into Excel. First, sign up for a free account on the weather query page if you don’t already have one. You can then enter your location, select the date range, and submit your historical weather query. After the query is run you can view the results directly on the webpage or download the results for further analysis. Note that the heat index and wind chill values will only be populated for records that meet the validity criteria discussed above.
Another option is to run a query via the Visual Crossing Weather API. Using an API allows you to run your query from inside any script or code automatically. The Visual Crossing Weather API uses a simple query URL to define a weather query. You can run this URL in a command-line tool such cURL, in your own script or code, or even directly in a web browser. The query returns the weather results including heat index and wind chill in CSV or JSON format. CSV results are easily loaded into a database or data science tool while JSON is a format that is easily parsed in languages such as Python and Java. If you follow our how-to guide, you can learn how to run your first weather API query in just a few minutes.
Summary
Heat index and wind chill are historical weather measures that are important for many business and personal activities outdoors. Tracking these two measures will allow you understand the comfort and safety of people and animals during hot and cold periods. Using Visual Crossing Weather, it is easy to find historical “feels like” data for any worldwide location in multiple convenient ways including the weather query page and the fully embeddable weather API for your code. Visual Crossing weather makes finding heat index and wind chill data simple.
If you would like to learn more about heat index and wind chill data in Visual Crossing Weather, you can read more in our data documentation. If you have questions about this data or weather data in general, reach out to our weather experts. We’ll be glad to help you get the weather data that you need.