

I am currently investigating the relationship between weather conditions and accidents by using a dataset of road accidents in Fairfax County, Virginia obtained from the Virginia Department of Motor Vehicles.
The first step to perform the analysis is to combine the accident data with the historical weather conditions. In this article, we will discuss how we take the raw accident data and integrate that data with historical weather data.
As we have over 3000 rows of accident data, we are going to automate the combination of the accident data with the weather data to produce a final dataset that we can use for continued analysis. To do this, we will write a Python script that uses Pandas as a way to easily load and process the accident data and combine it with the historical weather data.
The weather data will be sourced from the Visual Crossing Weather API that makes it simple to load accurate weather history observations for the time and locations specified in the accident reports.
Full source code
The full source code and sample data for this article can be found on our GitHub repository at: https://github.com/visualcrossing/WeatherApi/tree/master/python_samples
Source Accident Data
The source accident data we will be using includes accident data for the first half of 2020 in Fairfax County, Virginia, USA. The data includes the location of the accident expressed as a latitude, longitude location and the date and time of the accident. In addition, the data includes various attributes about the accident such as amount damage and whether or not there were any injuries:
| Document Number | Crash Date | Crash Type | GPS Latitude | GPS Longitude | # of Fatalities | # of Injuries |
| 200175064 | 1/16/2020 0:11 | Property Damage | 38.948 | -77.30635 | 0 | 0 |
| 200695123 | 3/4/2020 7:57 | Property Damage | 38.95545 | -77.40207 | 0 | 0 |
Historical weather data lookup
To look up the weather observations for each row of accident data, we need the location, which we can obtain using the latitude and longitude columns, and the date and time. The Weather API provides hourly temporal resolution from many weather stations, so we can look up the weather conditions very accurately.
In addition to the weather, we will also request the sunset and sunrise times, so we can determine if there is relationship to the state of the sun compared to accidents.
The following represents the weather API query to look up the weather for our first row of accident data above:
https://weather.visualcrossing.com/VisualCrossingWebServices/rest/services/timeline/38.94800,C-77.30635/2020-01-16T00:11:00?unitGroup=us&key=YOUR_API_KEY&contentType=json&include=current
We specify the location using the locations parameter: 38.94800,-77.30635
The date and time using the start and end date time parameters: 2020-01-16T00:11:00
We then include a set of parameters to request data in US units (Fahrenheit and inches etc.). We ensure we request the data in JSON format and include our API key: unitGroup=us&key=YOUR_API_KEY&contentType=json&include=current
For more information on the parameters above, see the Weather API Documentation.
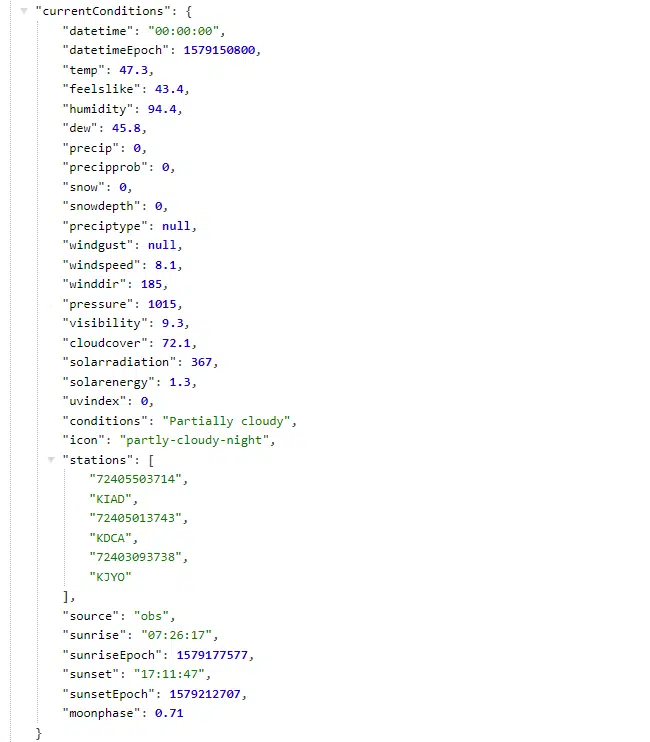
The result of the weather API request is a simple JSON structure that includes the requested weather data:
We can use this data to select the weather data values that we are interested in investigating. The exact date time data is returned in the ‘currentConditions’ property.
Using Python and Pandas to request weather data in bulk
As we have many rows of accident data, rather than manually look up the data for each row, we will automate the data retrieval. This will also position the next phase of research to analyze if any weather or astronomical conditions correlate with the accident.
We will use a python script to perform the automation. Within the script, we will use a Pandas DataFrame to load and manipulate the data. This will help position the script to both store the joined accident-weather dataset and also be read for more sophisticated analysis of the data.
The Python script
We will use the following libraries to help simplify the Python script:
import pandas as pd
import math
import datetime
from datetime import timedelta
import urllib.request
import json
Pandas will be used for the DataFrame and the math and datetime libraries will be used for some simple error checking, parsing and transformation. The urllib and json libraries will be used to submit and parse the weather API requests.
We first use the pandas library to load the accident data from CSV file into a DataFrame :
raw_accident_data=pd.read_csv('Motor_Vehicle_Collisions_FairfaxCountyVa.csv')
In our first test we will create an array that combines the crash weather data. Here is the empty output structure:
records=[]
labels = ['Crash Date', 'GPS Latitude', 'GPS Longitude','Document Number','Crash Type','temp','precip','wspd','sunrise','sunset']
Now we have the input data loaded and our output structured defined, we can iterate through each for of the data to load the weather data:
#Step through the input data row by row. Reading the location as latitude and longitude and accident time. These will be passed to the Weather API
for i, row in raw_accident_data.iterrows():
    #check maximum rows to process and stop if necessary
    if maxRowsToProcess>0 and i>maxRowsToProcess:
        print("Maximum rows processed. Ending: {}/{}".format(maxRowsToProcess, len(raw_accident_data.index)))
        break
    #print a status update every 10 rows
    if (i%10==0):
        print("Processing row {}/{}. records size={}".format(i,len(raw_accident_data.index) , len(records)))

    #read the latitude, longitude and data from the source data
    latitude=row['GPS Latitude']
    longitude=row['GPS Longitude']

    #check that the latitude and longitude are valid. skip row if necessary
    if math.isnan(latitude) or math.isnan(longitude) or (latitude==0 and longitude==0):
        print("Bad latlon {},{}".format(latitude,longitude))
        continue

    latitude='{:.5f}'.format(latitude)
    longitude='{:.5f}'.format(longitude)

    datetimeStr=row['Crash Date']

    #check that the date_time are valid. skip row if necessary
    try:
        date_time=datetime.datetime.strptime(datetimeStr, '%m/%d/%Y %H:%M')
    except ValueError:
        print("Bad date format {}".format(datetimeStr))
        continue

    #the Weather API specific time truncates to the previous hour.
    #If the minute>30, add another hour so it rounds up to the next hour.
    if (date_time.minute>=30):
        date_time=date_time+timedelta(hours=1)


    documentNumber=row['Document Number']
    crashType=row['Crash Type']
In the first part of the loop we read the core information from the Pandas dataframe row. We then perform checks to make sure the input data is complete and useful. This includes ensuring the latitude, longitude and date time are valid. Finally, we ensure that the latitude has five decimal places.
Note that we parse the date time into an actual date time value so that we can then reformat it for use in the query in the next step.
We can now submit the Weather API request for the row values we have read above:
 #Request data using Timeline Weather API specific time request.
 #See https://www.visualcrossing.com/resources/documentation/weather-api/timeline-weather-api/ "Specific Time Request Example" for more information.

 weatherApiQuery = 'https://weather.visualcrossing.com/VisualCrossingWebServices/rest/services/timeline/{},{}/{}?unitGroup=us&key={}&contentType=json&include=current'

    weatherApiQuery=weatherApiQuery.format(latitude,longitude,date_time.isoformat(),weather_api_key)

    try:
        response = urllib.request.urlopen(weatherApiQuery)
        data = response.read()
    except urllib.error.HTTPError  as e:
        ErrorInfo= e.read().decode()
        print('Error code: ', e.code, ErrorInfo)
        continue
    except  urllib.error.URLError as e:
        ErrorInfo= e.read().decode()
        print('Error code: ', e.code,ErrorInfo)
        continue
We insert the row parameters into the preformatted query parameters string. Then we submit the Weather API request.
We parse the request using the JSON library into a variable called ‘weatherData’. We check that no error code was returned (if it was then we continue to the next row).
We are now ready to extract the weather data we are interested in.
#parse the response JSON
weatherDataJson = json.loads(data.decode('utf-8'))

#read exact time weather data from the 'currentConditions' JSON property
weatherData=weatherDataJson["currentConditions"]

#create an output row using the crash and weather data
    records.append((date_time.isoformat(),latitude,longitude,documentNumber,crashType,weatherData["temp"],weatherData["precip"],weatherData["windspeed"],weatherData["sunrise"],weatherData["sunset"]))
The json is a collection of locations which in turn include a collection of weather data values. In our case there is simple a single location (for the latitude, longitude we requested for the crash location) and a single value (or the time of the crash).
We can therefore create a single row of output data from the input pieces of data plus the temperature (“temp”), precipitation (“precip”), wind speed (“windspeed”), the sunset and sunrise.
The final part of the script in this first step is to save the data as a CSV that includes the crash and weather data.
output_df = pd.DataFrame.from_records(records, columns=labels)
output_df.to_csv('output.csv', index=False)
We use the Pandas data frame again to perform this conversion and save to disk. Here’s what the output looks like:
| Crash Date | GPS Latitude | GPS Longitude | temp | precip | wspd | sunrise | sunset |
| 2020-01-01T00:01:00 | 38.83146 | -77.23923 | 43.4 | 2.8 | 2020-01-01T07:27:27-05:00 | 2020-01-01T16:57:28-05:00 |
Closing thoughts
We are now ready to perform analysis on the data to see how weather affects accident events.
If you have data that you would like to combine with weather data to perform analysis and investigation, check out the Weather Data Services page where you can sign for a free trial, view and download historical and forecast weather data and even build Weather API queries like the ones we have used in this example. You can also see how to include weather data in Power BI, Microsoft Excel, MySQL or any programming language.
Questions or need help?
If you have a question or need help, please post on our actively monitored forum for the fastest replies. You can also contact our Support Team.