

Look up typical weather conditions for anywhere instantly
Find typical weather conditions by searching for a city, zip code, or address. If you want to select a specific date on the next page, simply click on the Modify button in the upper right.
Visual Crossing’s tools enable you to find the typical or average temperature conditions for any city or location worldwide. This can be useful for planning trips, events, and projects that are out of the short-term forecast range. Whether you have a vacation coming up in Venice or are simply curious about what the weather is like in a certain part of the world, our Visual Crossing API can handle the task.
How to Find Typical Weather for Any Location and Date
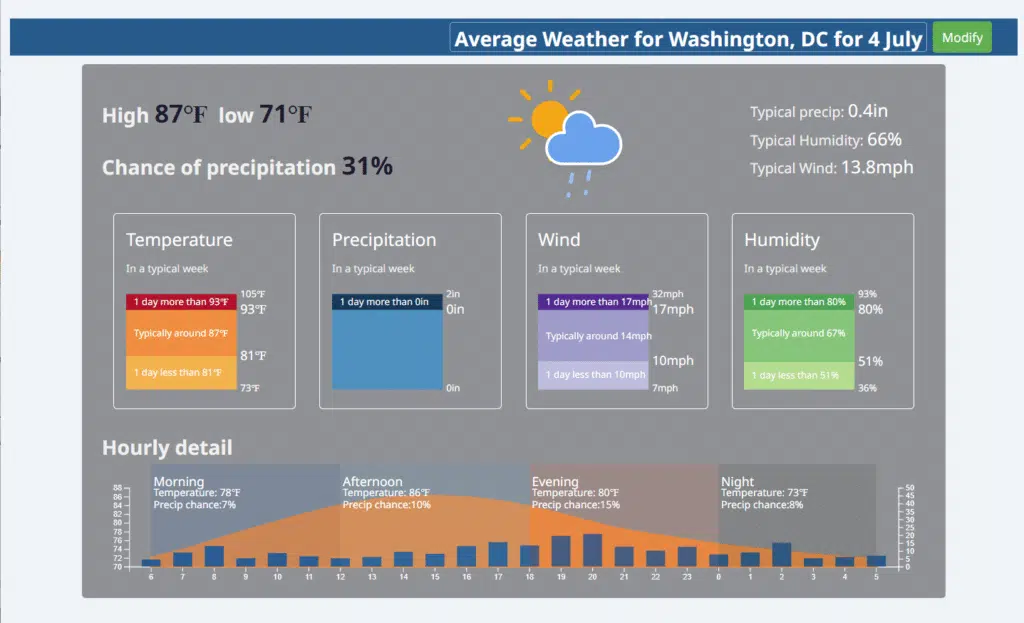
To start, you’ll visit the Average Weather page on the Visual Crossing site. Enter your location and date, then click the Load Weather Data button. This dashboard provides hourly weather data, including average temperature, precipitation, wind, humidity, and daypart patterns. With this tool, you can plan for potential weather conditions in your chosen area on any given day. It is a fast, easy, and free way to learn more about the weather where you intend to visit, all without having to perform any calculations yourself.
Why Typical Weather Data is a Valuable Planning Tool
Understanding the typical weather in a given area is crucial when selecting travel dates, planning events, or preparing for job site conditions. Visual Crossing’s Weather Forecast Dashboard is an excellent option if your event is within the next 15 days, but many people need to plan their schedules weeks or months in advance. This is where our typical weather conditions tools come into play.
Here are just a few examples of how you can apply our tools.
Comparing Weather Conditions at Different Destinations: If you’re choosing between Universal Studios in Orlando, Florida, and Disneyland in Anaheim, California, for a summer vacation, you’ll want to know things like the total precipitation you can expect during your trip.
Using Environmental Information to Plan Trip Dates: Visibility is crucial for those who want to go hiking in the mountains or see certain landmarks, like Mt. Rushmore. If your travel dates are not set, you can choose a better time to go.
Identifying the Best Time for Outdoor Sports: Things like snow depth can be critical considerations if you enjoy snowshoeing or skiing. Knowing the typical snow depth for your chosen destination lets you visit when there is maximum snowfall, and the powder will be in good condition.
Studying Potential Relocation Options: Weather is often an important factor in where people choose to move. Things like typical precipitation and humidity may significantly influence whether a specific city or even a ZIP code is the right choice. By looking at expected weather patterns across a few dates, buyers can decide whether they would be comfortable in their new home.
Preparing for the Weather at a Destination: If you’re heading off to a conference or family reunion, you want to ensure you’ll pack the right clothes, whether that’s for freezing cold weather or blistering sun.
Planning Outdoor Projects: Those in construction, agriculture, or environmental sciences need to schedule carefully to protect their workers and get the best results from their projects. If a given date has a historical temperature well into the 90s, they can plan to push the project back until the maximum temperature is in a safer zone.
Protecting Human Health: Some individuals are more sensitive to heat or cold than others. What may be comfortable or safe for the rest of the population may cause extreme reactions. By searching specific dates, individuals with underlying health issues can ensure they will be able to withstand the average temperatures in a given location.
Infrastructure Development: For companies, cooling degree days are a critical consideration, as this can influence energy usage. If your company is planning on expanding operations to a warmer area, knowing the mean temperature can help you predict potential needs for your new office.
Our Typical Weather API has many other applications, whether that’s reviewing environmental information for a worksite or studying the climate in a select location. Once you’re closer to the event, you can use our Weather Forecast dashboard to receive more precise information from local weather stations.
Typical Weather Access via API
Visual Crossing’s Timeline Weather API offers seamless integration of typical weather and climate data into tools, apps, and websites.
The API will intelligently pull the correct data based on your query. If you request a historical date, it will offer historical temperature and weather data, while it offers forecast conditions when the date is within 15 days of the present. For dates more than 15 days in the future, our API will calculate average conditions based on climate data from the previous few decades.
Signing up is free, and you can begin using the Visual Crossing Weather API within minutes. We provide extensive documentation on implementing our API in several programming languages, including Python and JavaScript.

How Typical Weather is Calculated
Visual Crossing’s Weather Engine runs statistical algorithms on decades of historical weather, both day-by-day and hour-by-hour.
The calculations can include millions of records gathered across multiple decades from several weather stations closest to the queried location. Choose the correct city, or, for more precise information, use the latitude and longitude coordinates. We also provide historical data for every ZIP code in the United States.
We collect a time series from different stations at consistent times of the day to create an accurate dataset. In general, our databases will fetch data from the last 30 years on a given date. This offers enough data to calculate an average.
The Weather Engine will also examine data from surrounding dates to develop more meaningful results. The closer a date is to your query, the more likely it is to show similar weather conditions. For example, July 3rd and July 5th are more likely to have similar average temperatures to July 4th than July 30th.
This produces a long-term average of things like maximum and minimum temperature, precipitation, and wind speed. Together, the data gives an accurate picture of daily and hourly conditions for that specific area.
For example, temperature fluctuates throughout the day due to different solar radiation levels. However, precipitation and wind speed can also follow daily, monthly, and yearly patterns based on geography. A valley that is in the rain shadow of a mountain may have higher minimum temperatures than places at higher elevations, but it will also have higher wind speeds at different times of the day.
While these statistics do not perfectly predict the weather on a given day in the future, they can give you a general idea of what weather you can expect throughout the day. This can be invaluable for planning outdoor activities. If the maximum temperature is 84°F on a certain day, and the temperature usually peaks at 2 pm, you’ll know it’s best to take a break indoors before going back outside.
Retrieving and analyzing this much data is resource-intensive, but it also ensures the most accurate and meaningful results. We have designed our Weather Engine to quickly and precisely calculate averages for any given location or date.

Can I Calculate It Myself?
While it is technically possible to perform your own calculations using raw weather data, this requires significant data processing and statistical analysis skills. Even professional climatologists and environmental researchers usually prefer to use predeveloped solutions like those from Visual Crossing. This is a simple guide for what you can expect should you attempt to calculate typical weather on your own.
Raw historical records for the past 30 years are available through the Visual Crossing Weather API. You would need to retrieve more than a quarter of a million records for one single location for your analysis. If you want to query more than one location, multiply the number of locations by the number of records required.
The number of records mentioned above is only for one day, such as July 4th. The Visual Crossing Weather Engine draws in additional data from adjacent dates, like July 3rd and July 5th, to provide a better picture of expected weather. For every date that you add, you exponentially increase the amount of data you must process and analyze. This is especially true if you want to query individual days from multiple weather stations for a better look at potential conditions.
After retrieving the records, you would need to use an analysis package like R Studio to review the information and draw conclusions. You may also have to build the logic from scratch in a language like Python or Java. You’ll of course want to ensure all links are active and all values have been accurately mapped in your dataset.
Analyzing this enormous amount of data, much less building your own logic, is a difficult and time-intensive task that is beyond the scope of what most users would like to do. Professional developers typically avoid this task by relying on trusted sources like the Visual Crossing Weather Engine.
Additionally, the calculations required take significant computing power. Your home computer may not be able to analyze all of this data in a reasonable timeframe, especially if you have other applications running.
Visual Crossing’s tools are a more scalable solution, letting you harness the power of our Weather Engine without having to sort through all the data yourself. We make it easy to sort through hundreds of variables, such as ground temperature, maximum and minimum temperature, precipitation, wind speed, and more.
You can select which values you want to include and instantly gain access to a wealth of information for a given day, based on hundreds of thousands of records. A free account with Visual Crossing allows you access to our basic tools, and you can sign up for a premium account if you need even more specific details. We also offer extensive documentation and support for many different applications and programming languages.
Know the Limitations of Statistical Weather
While typical weather conditions can be very useful for long-term planning, they still reflect averages and are not guarantees. Rare extremes can occur that may surprise you if you only access typical weather information and not real-time data from local weather stations.
The July 4th example above shows an average maximum temperature of 87°F and average minimum temperature of 71°F with a typical 31% chance of rain in Washington, DC. However, global warming has meant that the Atlantic Coast has regularly been hit with severe heat waves in June and July, with millions affected by temperatures as high as 105°F. In 2024, the maximum temperature on July 4th was 92°F.
Because the Weather Engine looks at longer periods of time, this higher maximum temperature only pushed the average temperature up by a fraction of a degree, which does not wholly represent the difference.
Precipitation averages are another common concern. If someone is planning an outdoor event on a day that typically only has a 10% chance of rain, an unexpected spring shower could be a serious problem. In winter, sudden snowstorms may cause travel delays or reduce access to certain locations, which historical data could not have predicted.
Visual Crossing’s Weather Engine is one of the most reliable predictors of weather events available for free, and it is a useful planning tool for a variety of applications. However, weather changes quickly and cannot be perfectly predicted months in advance. Depending on your specific use case and season, data about historical extremes may prove vital to your needs.
Summary
Visual Crossing’s Average Weather dashboard and API make it simple to view typical conditions for any location and date in the world. The granular analysis and worldwide coverage make it an invaluable tool for planning, development, data analysis, and more. While statistical weather does have limitations, it is the most accurate method to plan for weather conditions outside of the usual 15-day forecast window.
If you’re interested in learning more, review Visual Crossing’s extensive knowledge database. We provide helpful articles for planning applications, visualizing data, and troubleshooting common errors. You can also get real-time help through our forum or contact our technical support team for more information.