


As the world of travel begins to open up again, the planning for the summer vacations will also rise sharply. Where better to go than Universal Studios in either Florida or California? One of the utmost concerns when travel planning is understanding the climate and specific weather forecast so that we can properly prepare clothing, umbrellas, hats as well as ways to keep cool. In this high-demand environment, we need to plan early! There are two different stages to planning: initial site scouting and pre-travel preparations in the days leading up to the trip. This blog will teach you how to find out the weather conditions for your your initial planning far before the meteorologists can give you a forecast.
Climate vs Forecast
In the initial planning stage, you probably want to know if it is even worthwhile going to a spot like Universal Studios. Perhaps you even have a choice between the two locations in Florida and California. When considering weather for these locations, a 15-day forecast is typically not long enough to know what the weather will be like in a month or more which is required for reservations. Forecasts are based upon models of current conditions across the globe and cannot help us in the initial phase to know if this is a good time to go to Universal Studios. This is where long-term forecasting and climate analysis comes into play. For this stage of planning you want to know what is the “typical” or “average” weather for your trip. What we need here is a way to see “Around July 15th what is the Typical Weather for Universal Studios?” . We will use the Visual Crossing (www.visualcrossing.com) Average Weather Dashboard to help us figure this out. Here are two links that will forecast to two cities where the Universal Parks are located.
Universal Studios Orlando:
https://www.visualcrossing.com/average-weather/Orlando%20Florida/2021-07-15
Universal Studios Hollywood:
https://www.visualcrossing.com/average-weather/Hollywood%20California/2021-07-15
Analysis
Let’s start with an analysis of the Universal Studios location in Orlando, FL for July 15th:

This dashboard looks back at the last 10 years of data around July 15th and calculates the statistical averages of all weather conditions as well as the extremes. This way we can know what is “possible” as well as what is “likely”.
Let’s break down the pieces of the dashboard:

This first box gives us the Average of Daily High Temperature values and the Average of Daily Low Temperatures. Statistically speaking this is your daily range that you can expect.
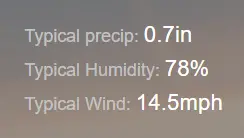
The box to the right will give you your typical daily statistics for Precipitation, Wind and Humidity. We are seeing high humidity, a decent wind to cool things off but the rain is non-trivial. Let’s look at more detailed breakdowns of a typical week to help us understand what we can really expect.
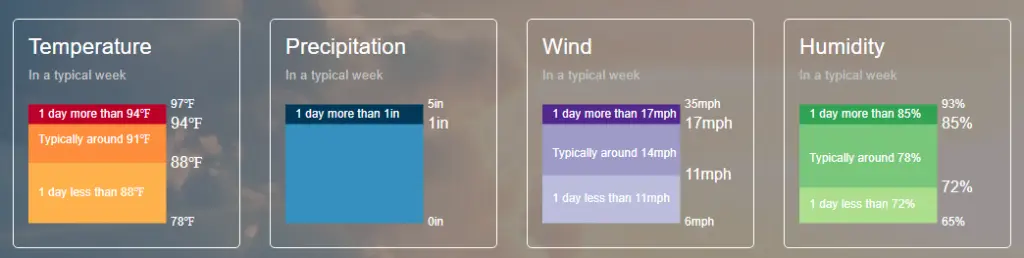
Here we can see each condition variable as well as the weekly distribution and extremes. Looking at the temperature box (orange to red distribution) we know the following is true:
- Typically the high temperature during the week is around 91 degrees
- It has gotten as as hot as 97 and as low as 78.
- One day a week it goes above 94 degrees.
- One day a week it can go below 88.
Rain?
The most compelling statistic that we learned here was regarding precipitation! July is considered to be in the rainy season in Florida. When we think of Florida, the “Sunshine State”, we may think of humidity but typically we don’t think of rain. At least for those of us who go there once every few years…

Our overall statistic tells us that there is a 48% chance that it will rain at some point during any given day at Universal Studios Orlando. Definitely bring a rain poncho with you to the park. This doesn’t mean that it will rain most of the day or will drop 2″ every day. What it does mean is that sometime during every few days it will rain, possibly for a short burst of time, possibly longer. Let’s look at the final piece of our dashboard to clarify that even more and see if we can pick up any patterns.
Hourly Detail
The hourly detail section helps to clarify the intra-day question of “when”, not only for when we reach high temperatures but at what time of day we are likely to see rain?
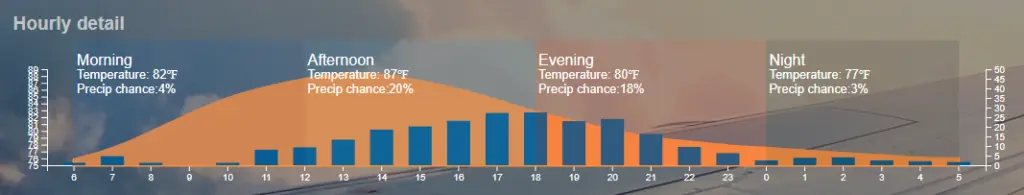
Over our statistical 24 hour period, we can see from the orange colored fill graph that we reach maximum temperature at 1 or 2PM. We can also see from the blue bar graphs that most of the rain during the analyzed period occurs typically in the late afternoon or evening. This is incredibly helpful for our planning purposes!
Florida or California
Just for comparison, lets look at Universal Studios Hollywood in California.
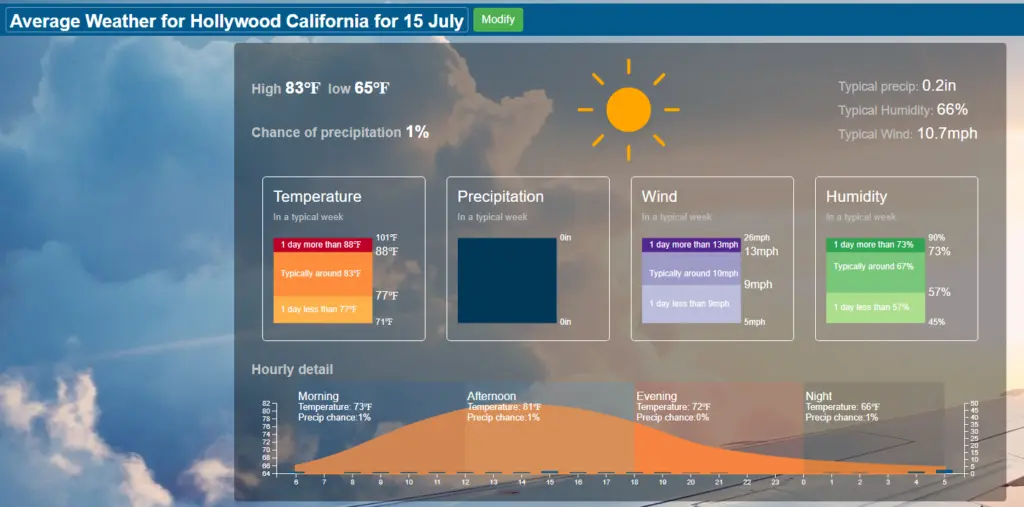
No rain, temperatures in the mid 80s, low humidity and virtually no rain. Certainly Hollywood is the preferred location in summer months if you have that option and if all other considerations are reasonable.
Your Turn
If you want to test another week or another location just visit the dashboard using the links and click the “Modify” button to enter your own preferred date and location.

Universal Studios Orlando:
https://www.visualcrossing.com/average-weather/Orlando%20Florida/2021-07-15
Universal Studios Hollywood:
https://www.visualcrossing.com/average-weather/Hollywood%20California/2021-07-15
Be sure to let us know if you learn some interesting facts about your vacation planning!