

One of the best utilizations of weather data in business is for ensuring that your shipment of sensitive materials will not be damaged due to heat or cold exposure. Everything from candy, wine, beer, plants, photographs and pharmaceuticals can all have their quality dramatically impacted from the weather. You will get an immediate return on investment by preventing returns as well as protecting your business’ reputation. In this blog entry we we are going to show you the simplest way to get started with weather to ensure safe shipments. For fractions of a penny you can trust that your shipments won’t sit in a hot mailbox. You can visit our product page for more information on how weather affects sensitive products:
https://www.visualcrossing.com/shipping-delivery-weather
Bring us your Locations
There are only two variables involved in protecting your shipments: Time and Location. Where are the packages going and when do we expect them to be at their locations. With Forecast data there is no need to provide time data as each query will give you a full 15-day forecast at every location. To get started, you only need a list of your shipping locations. These can be cities, zip codes, full addresses or latitude/longitude values.
Weather Forecast Queries
There are many ways in the Visual Crossing Weather infrastructure to complete a successful forecast query. To see the myriad of standard options you can search our blog listings here:
https://www.visualcrossing.com/resources/?s=forecast
Depending on the platform you use, your experience as well as your level of automation you can choose the best solution to get a forecast for your entire list of locations. One of the best differentiating features of Visual Crossing is that every query can accept multiple locations to give you the data that you need in a single pass.
But we are here to show you what we think is the most simple and effective way to repeatedly get shipment forecasts and identify possible problem locations. We are going to use a variation on our Multi-site Forecast Workbook called Shipping Forecast Workbook. It is a workbook dedicated to providing you with a full forecast for a large number of locations. This workbook is free for you to use and customize and is included with your subscription to the Visual Crossing Weather Service. You can find more information about the original Multi-site Forecast Workbook and how to use it here:
To download the Shipping Forecast Workbook you can visit the product page for Shipping Weather or you can download it directly from GitHub:
Once you have an account and downloaded the workbook, follow the instructions to enter your API Key which is found under the ‘Account’ tab on our weather data page. There are 2 simple steps starting with a copy-paste of your shipping locations into the workbook. You can paste in postal codes, cities, latitude/longitude values or take advantage of our interpolated weather accuracy and enter in specific addresses for these shipments.
The final step toward your first query is to click on the ‘Data’ menu in Excel and select ‘Refresh All’ from the Excel ribbon bar. This will submit a Forecast Query (using Power Query built into Excel) to the Visual Crossing Weather Service for all of your locations and return the forecast results into an Excel Pivot Table as seen below:
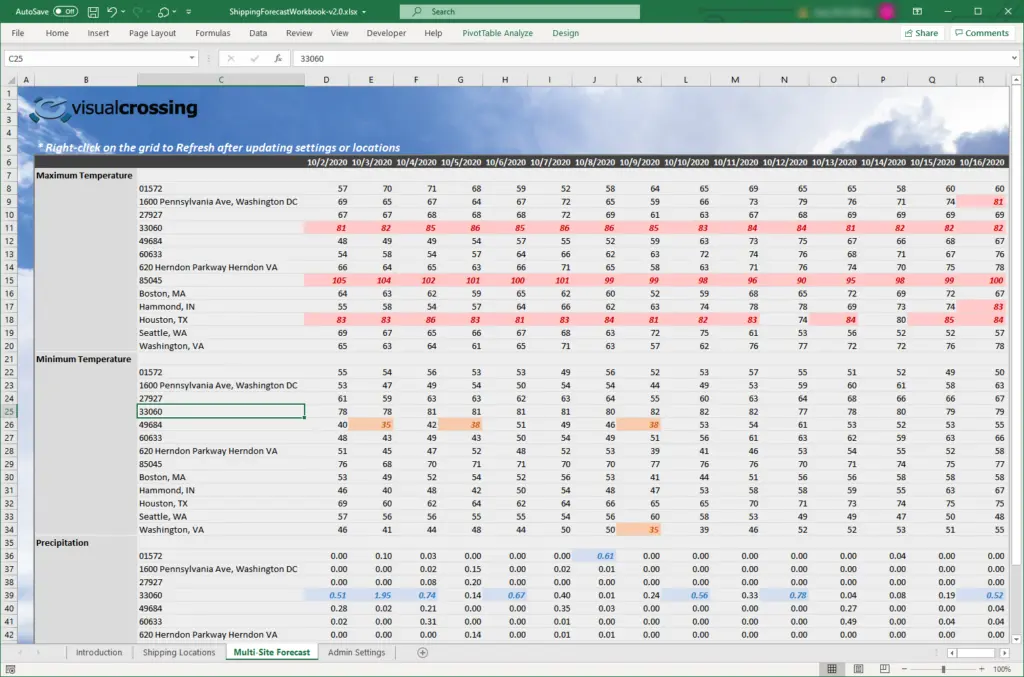
Setting Warning Thresholds
As can be seen in the photo, there is a great deal of additional value from using the Multi-site Forecast Workbook other than just downloading the weather data. Aside from the convenience of having it on your own desktop, you also have the power to choose the weather variables important to you and create highlighted threshold values for temperatures that exceed your acceptable limits.
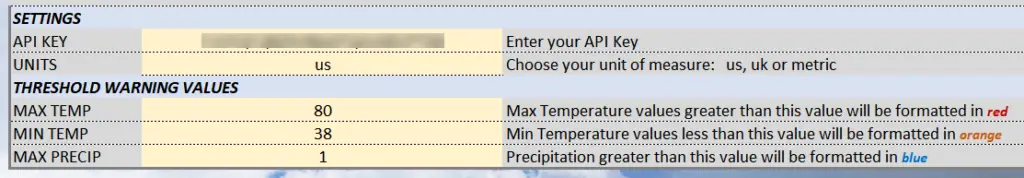
The default temperature and precipitation limits are easily editable and the Pivot Table in Excel is pre-configured to highlight those weather values that exceed your set values. This is a very easy way to see which locations are going to be “at-risk” delivery sites for you.
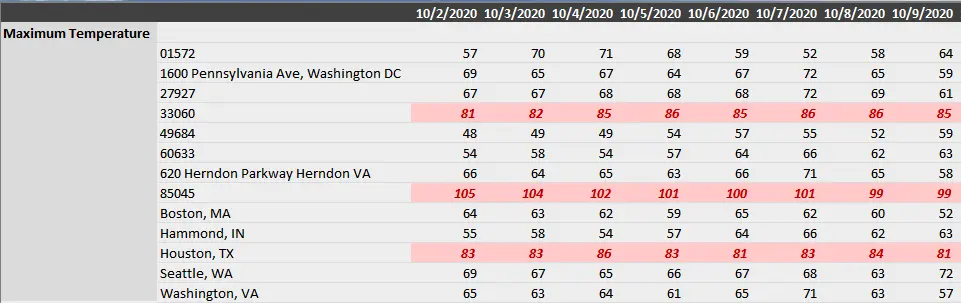
In our example above we can clearly see that the zip code for Phoenix, Arizona is going to have temperatures in excess of 100 F and shipping to this area will require a schedule change or alternate shipping method such as dry ice. Being able to easily detect and highlight temperature concerns in a list of over 1000 locations is a powerful feature!
Get Started Today
Visual Crossing offers special pricing for customers who are using the workbook for large number of location forecasts. To get affordable pricing for your weather deliveries visit our product page at:
https://www.visualcrossing.com/shipping-delivery-weather
One of the great things about the Multi-site Forecast Workbook is that it is fully customizable but you can also get started today by just entering your key and your locations. Start today by visiting our product page, download the workbook and sign up for an account.
If you have any questions or enhancement requests please email us at info@visualcrossing.com.