

If you have ever tried to download weather data for your specific location(s), timeframe and format needs you will know that it is a challenging exercise. Most of the time the solution is for you use the API to build a script or using coding to create this set. This creates additional cost, time and maintenance to get it right. Visual Crossing as a part of its Query Builder has given users the ability to build a packaged weather dataset that can we be scheduled to update as you need and can be retrieved either through a Web URL link or simply downloaded. In this document, we will show you the details of how you can build this set for yourself. We will link to other documents that will show you how you can further load these datasets into Excel, applications, scripts, ETL tools and more.
Sign-in
The first step is to sign up for an account and login or simply login if you already have an account. Please refer to this document and follow along in the account creation process. Remember that free accounts are available and offer up to 1000 free records per day.
Query Builder
For this exercise we will use the Query Builder to create our the packaged dataset that we will download. To begin, login to your account on the Visual Crossing homepage and visit the Query Builder page:
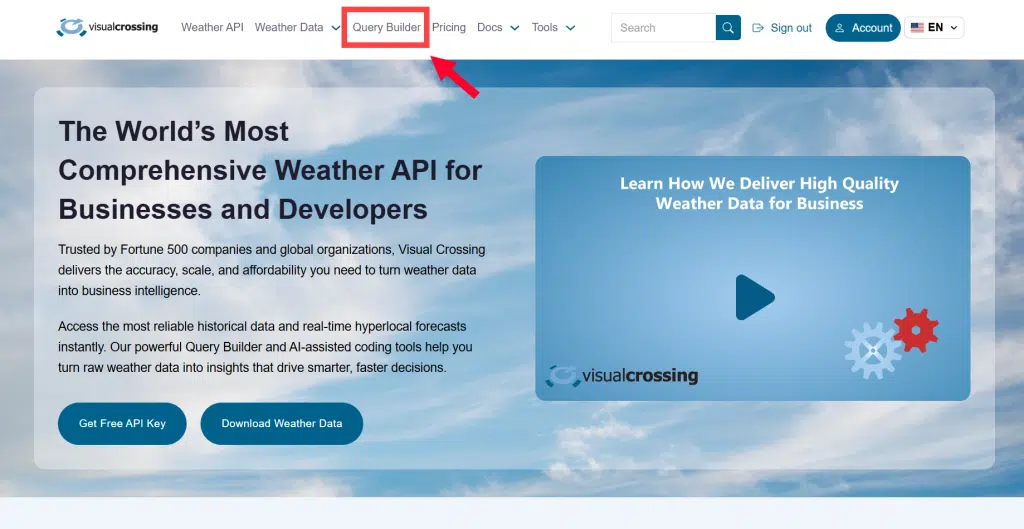
By clicking on either of the two links on the home page you will open the Query Builder. Query Builder was originally designed to build API Query Strings for developers to better help them design queries without knowing the full syntax of the Timeline API before getting started. Now it has an additional use for our data-direct users who wish to build a dataset to download immediately. This tutorial focuses on the dataset building but you can always copy the the API Query String from the “API” button and use it in code, scripts, Excel or even just paste it into a browser address bar. Let’s continue building a dataset…
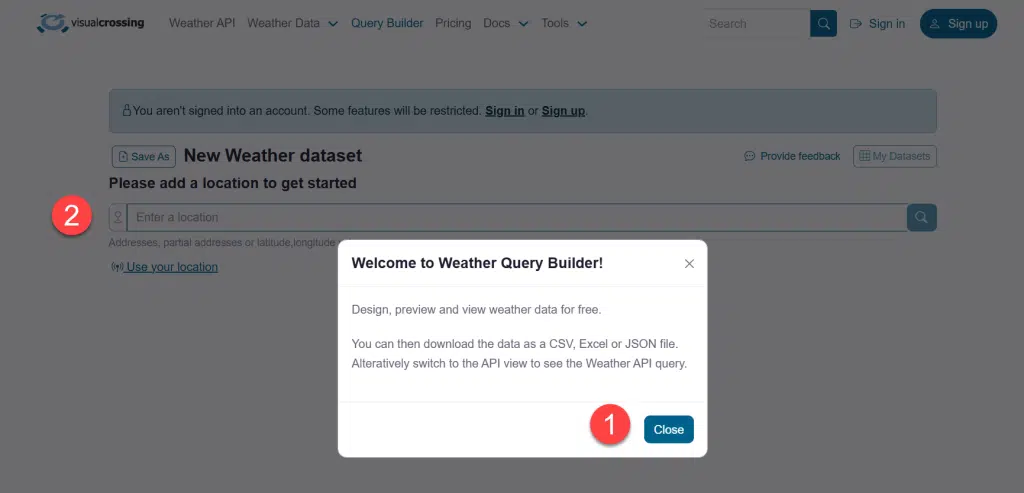
When you first visit the Query Builder page you will likely see a welcome screen which you can click ‘Close’ on and then start by entering a location and hit ‘enter’ or the search icon. This will transport you to the standard Query Builder interface and run an initial sample dataset for your location, which is by default the 15-day forecast for your location.
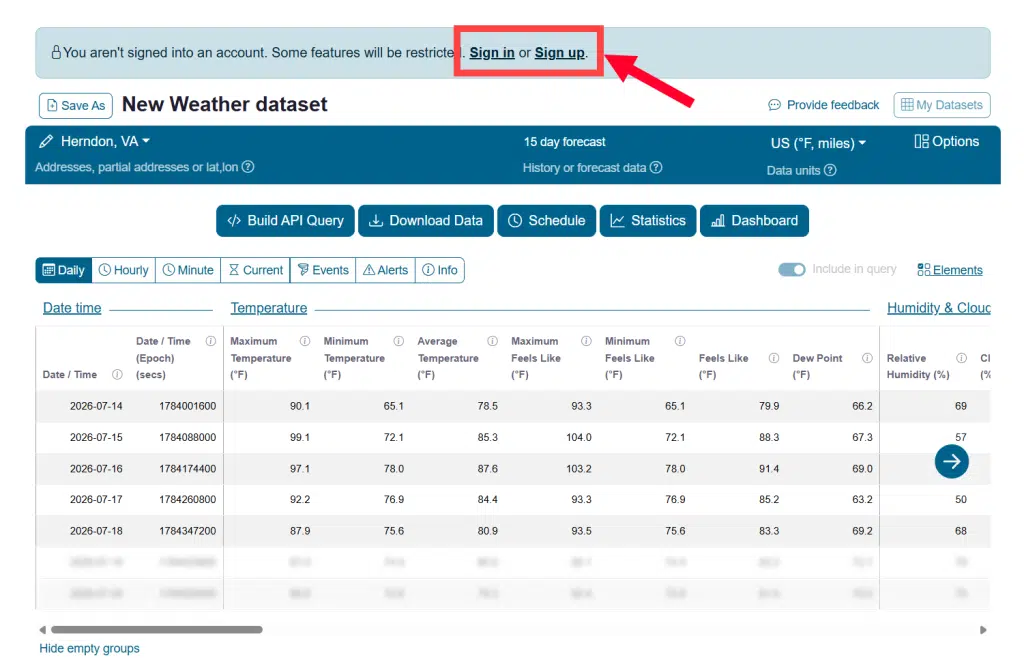
At this point, you can run simple datasets with strict limits as a guest but to build the dataset we want you will need at least a ‘Free’ account. Click ‘Sign up’ if you don’t have an account or click ‘Sign in’ if you already have one. Once you have completed this process, we can begin our dataset build.
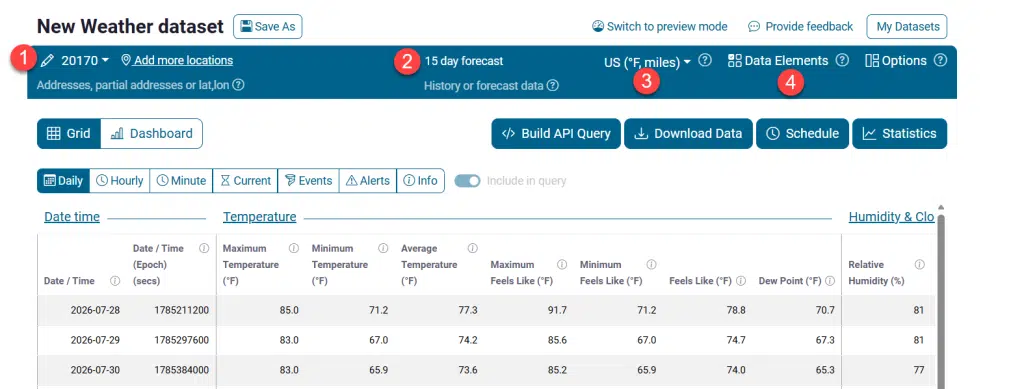
We will take you step-by-step through the creation and optional scheduling of your dataset. While the Query Builder is loaded with many features to build any dataset you want and contains advanced options to do so, we will take you through the 4 primary steps: Locations, Dates, Units and Elements.
Choosing the Locations
It begins in step 1 by asking you to define what locations you will be querying on. First we will open the Location Editor:
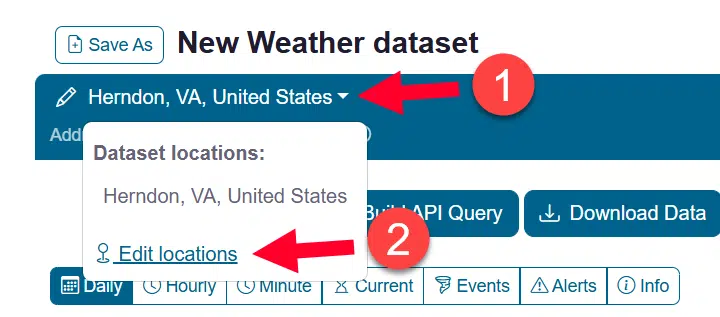
Once the Location Editor is open we can enter in locations one-by-one by typing them in or we can choose to import an entire file or clipboard of locations. For this exercise we will do the latter.
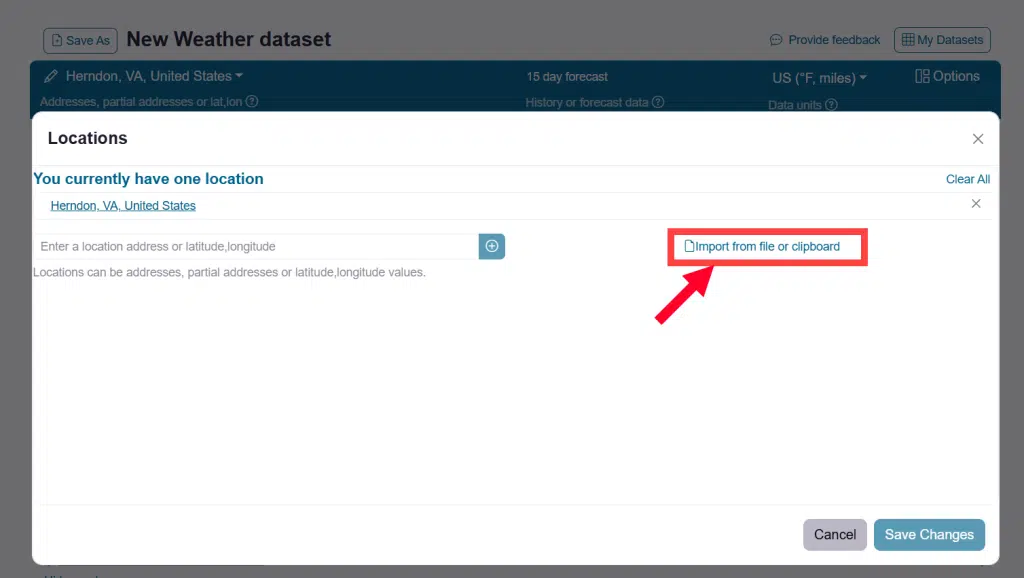
With this option we will load from a CSV (saved from Excel). We will choose to import our dataset from a file. Once we click on ‘Import from file or clipboard’ the following options will appear:
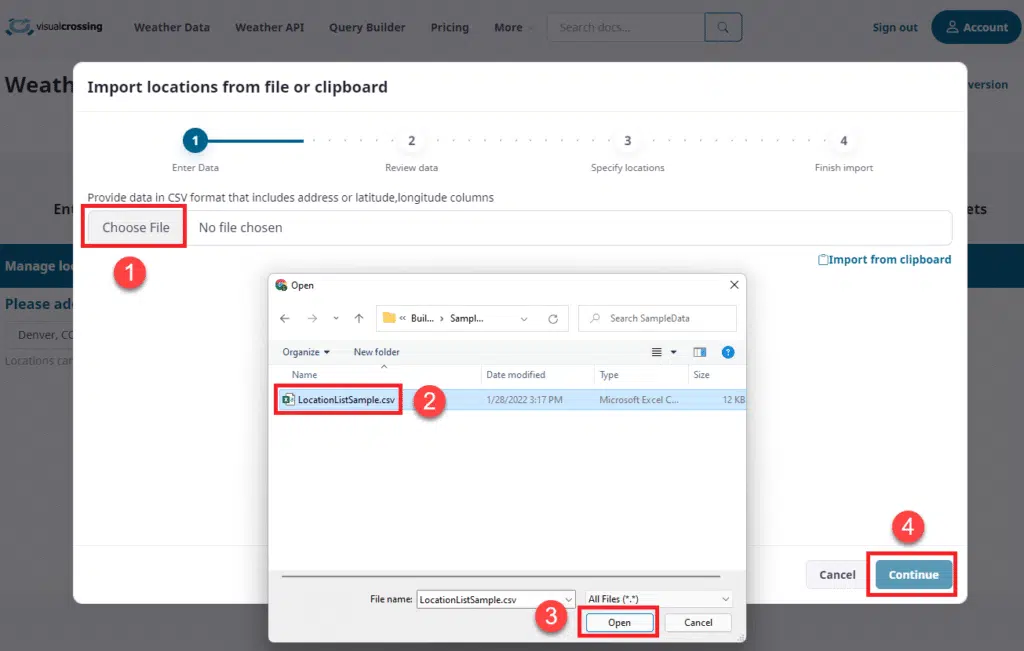
By clicking on ‘Choose File’ we open our system file chooser and select a dataset that has a column(s) with the address data for Query Builder to import locations from. Here we select our file and click ‘Open’ and ‘Continue’. As we can see below, Query Builder has read the dataset and will show us the data it has found.
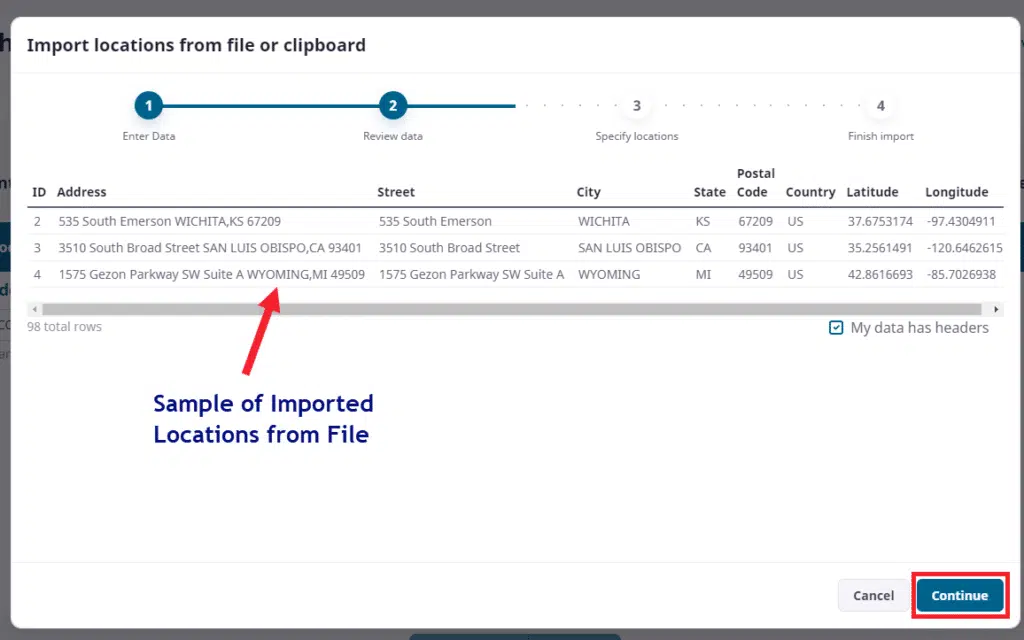
This step is an important verification step and you should look at the imported columns to determine which columns will make up your weather location address data and which column will represent the name of the location. In our example above we can choose to import using lat/longs in two different columns OR we can simply use “Address” column and let Query Builder translate the address to lat/long internally.
NOTE: A word of caution is that lat/long is almost always the best choice if you have the data. Address strings have to be put through a geocoder and while modern day geocoders are quite good, in some instances they can make mistakes and you should validate that the address it translated is in the right location. This is especially true in remote countries.
The next step is to assign our columns officially for both location and name.
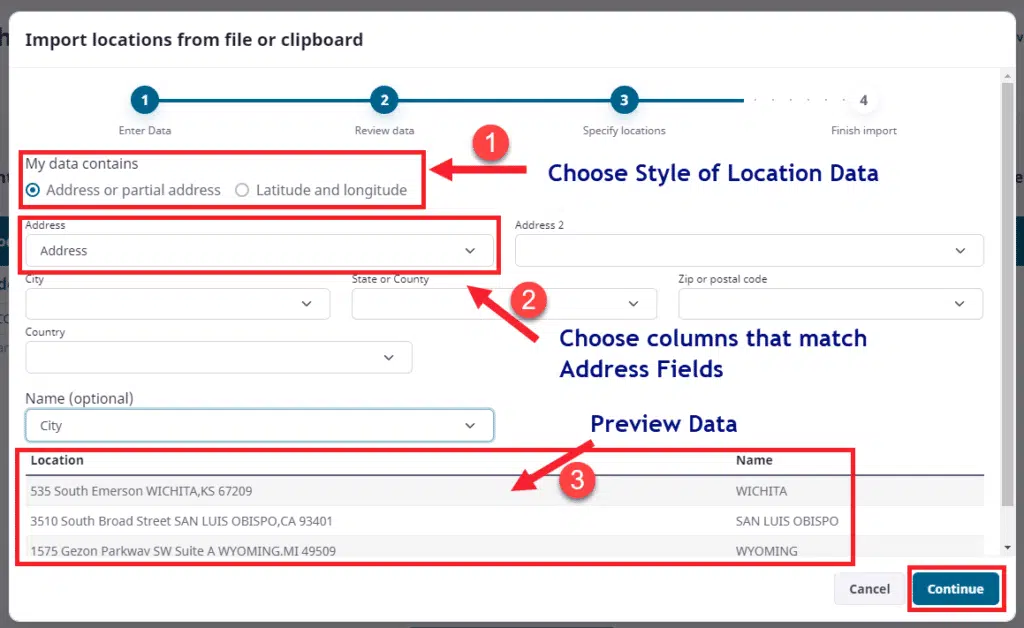
In the above example we will choose to import address strings in step 1. In step 2 we assign our “Address” column to the Address field. Note again that we could have constructed address from multiple columns should our dataset not have a single field representing the address. In this scenario we only need to fill out one field and leave the others blank.
Also as a part of step 2 we chose to use the “City” column as a recognizable name for our locations. The user can choose any name column they wish, including customer ID, store Name, Address, etc… This field is used for two primary purposes. One is for human readability of the final dataset, but also if you need to join this dataset back to another matching dataset after you download and import it into your systems. It is best to make sure the ‘Name’ field is unique whenever possible.
Finally in step 3 above you can see what final values you are giving to the system as your locations and name with examples from your file import. This is key to making sure that you don’t have repeated string data and in general that the addresses look complete and accurate.
Now we can click ‘Continue’ and move onto our next step.
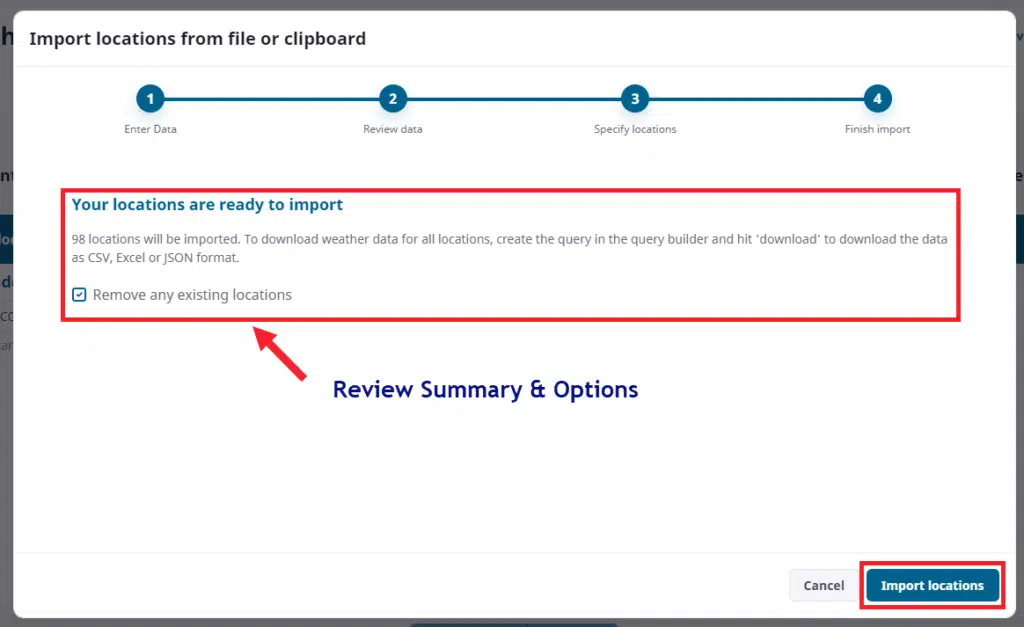
The final step on location import is to verify the number of locations and optionally ask the system to remove any prior locations you have from previous datasets. When you verify this information you can click ‘Import Locations’ to let the system complete its job.
Once complete you should now see the list of all imported locations and your first step in building a dataset is complete.
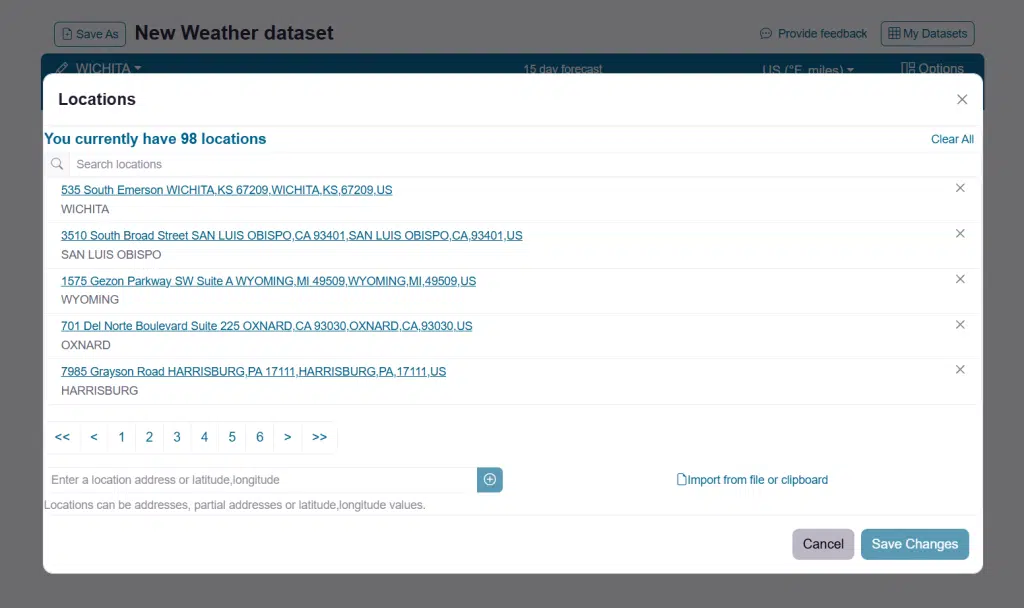
Here you can scroll through all imported locations if desired for validation. Once complete, simply click ‘Next’ to move onto our data selections.
Selecting the Date Range
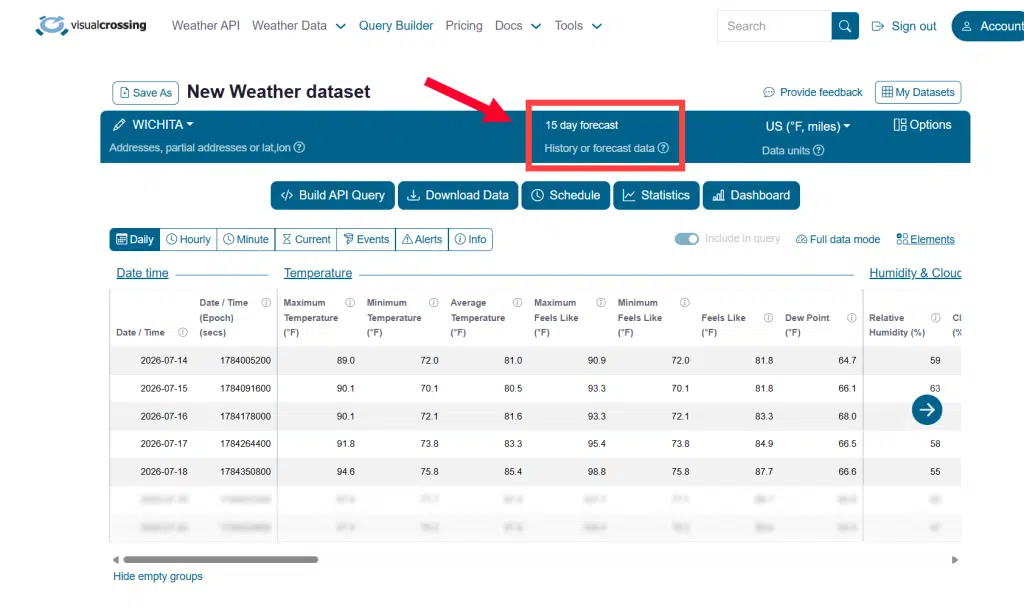
Step 2 of our overall dataset building task is to define what weather data we want to have in our Weather Dataset package. As we stated before, the default will be the 15-day forecast for your locations, but we can easily modify this for a large historical data package and more. Click on the “15 day forecast” area to change the date selection, once you do this it will open the Date Selection Editor.
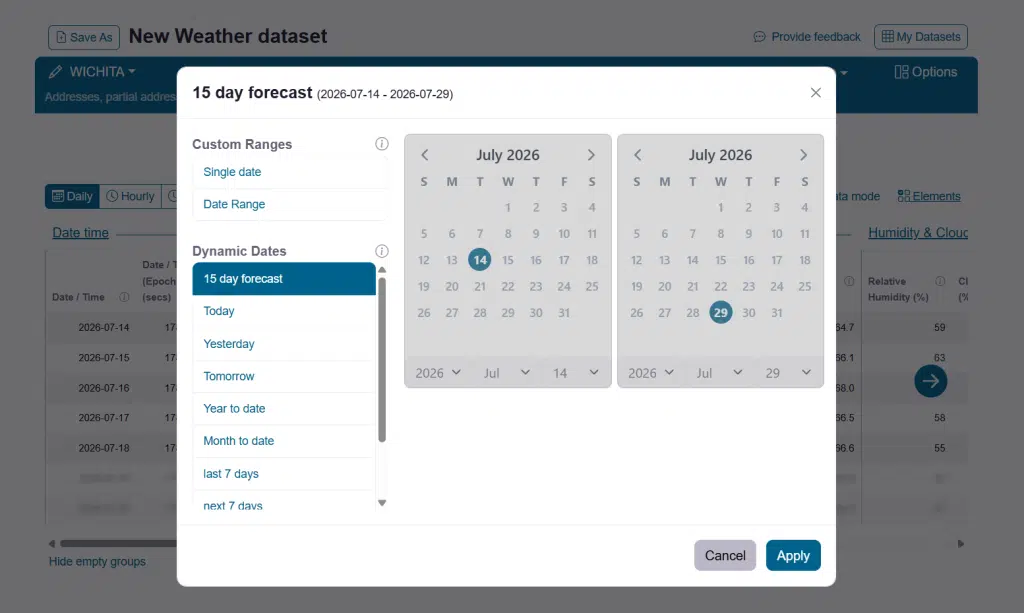
To pick your dates you can either choose from list of dynamic date macros such as ‘Today’ or ‘Last 7 days’ or ’15 day forecast’ OR you can choose to provide a specific date range from anywhere in the past (1970 or later) to the future. If you choose past dates you get station recorded data, if you choose 15-days into the future you will get model-predicted forecasts and if you go further than 15 days you will get a statistical forecast based upon 10 years of historical data for your location. The Timeline API that supports the Query Builder allows for a continuous timeline of weather. Let’s pick the dates we will use here:
For this exercise we are setting up a recurring dataset that will allow us to always get the last 7 days of weather data for all of our locations in our list. Above we choose one of the dynamic date macros called ‘last7days’. Every time this data set is run, either by schedule or manually it will pull the last 7 days of weather. Please note that it will only update when re-executed or if scheduled.
Selecting the Units
Next we will choose our units of measure. This is as simple as clicking on the current units selection on the blue control bar at the top of the page.
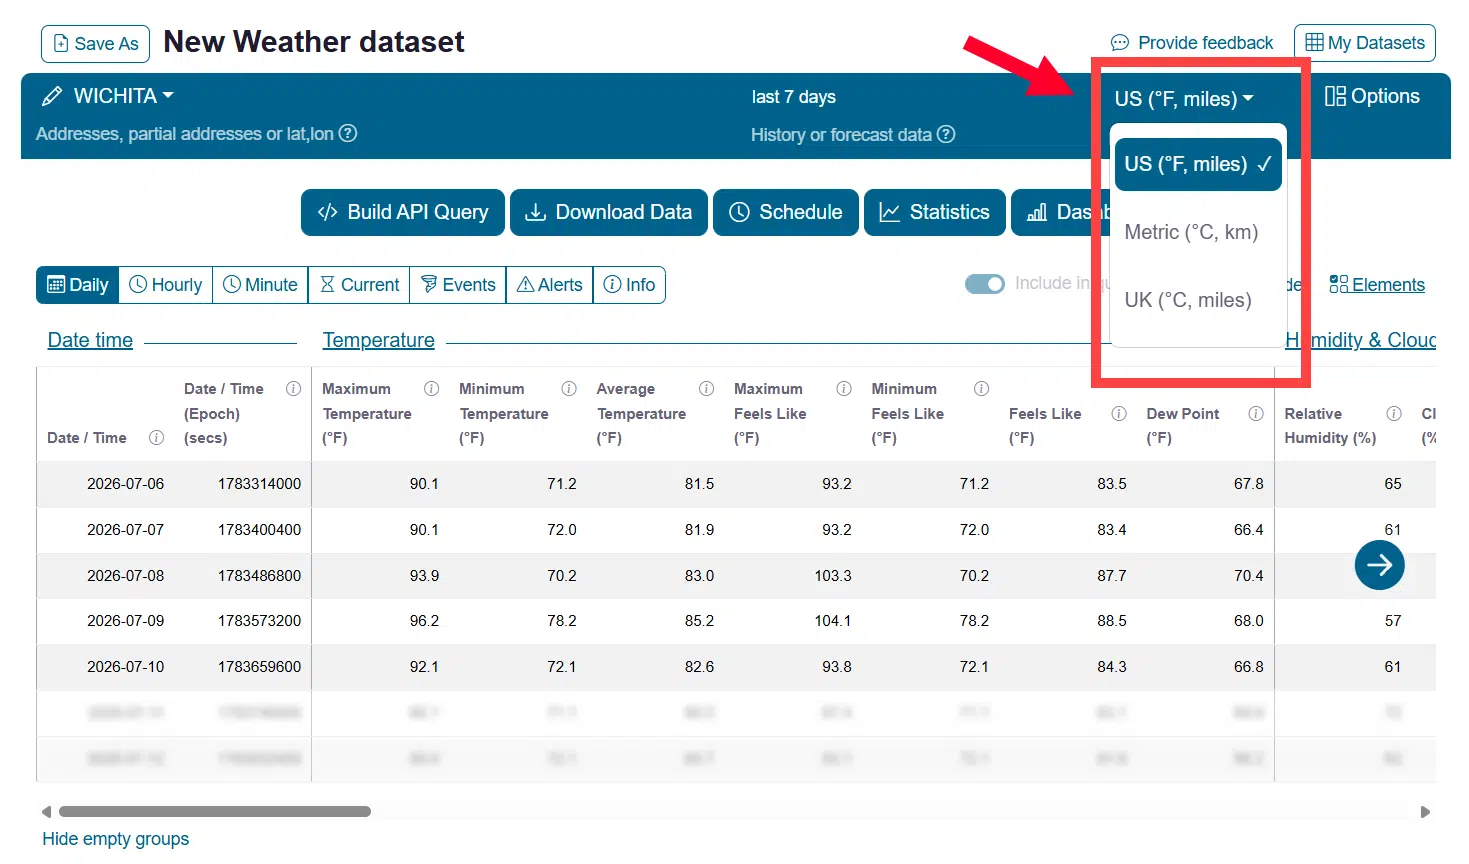
We will choose US units but you should choose what is appropriate for your scenario. To understand more about our units please refer to this document:
Selecting the Elements for the Dataset
Finally, we will get to pick the data we want to include in this dataset. This area contains the most information, much of which we will not be able to address in this basic tutorial. For this exercise we will make selections of specific weather variables and discuss where the data is retrieved from. Let’s start by opening the Element Chooser:
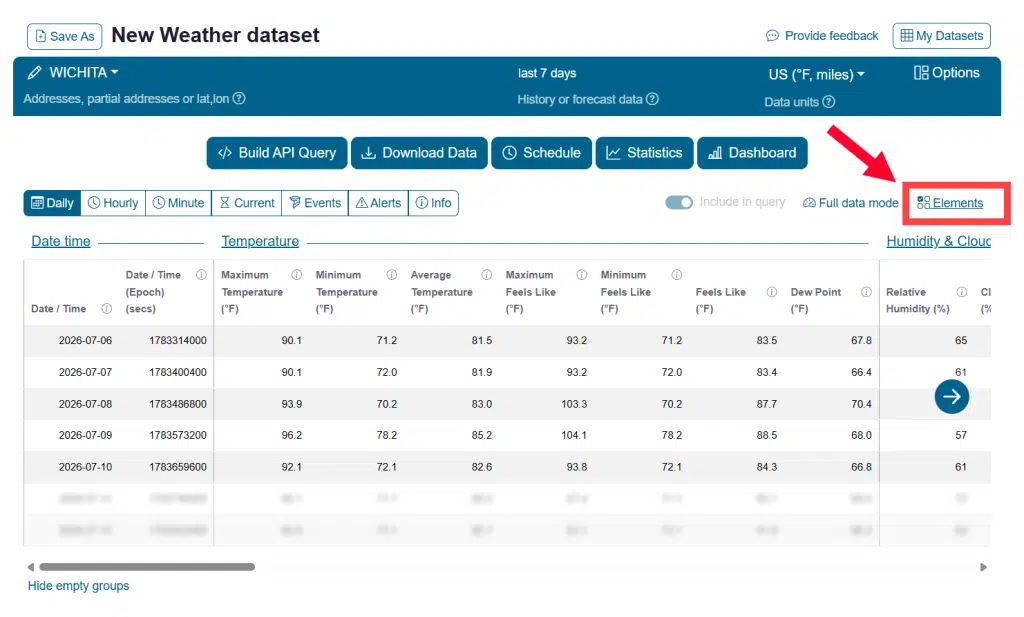
Once we open the editor you can see the categories of data elements available. Please note that there are specialty datasets that are only provided with advanced subscriptions and those will be noted as such. Also note that not all elements are available at the data time level. Temperature Max and Min for example are only available at the daily level whereas Average Temperature is the correct element for hourly and subhourly temperature values.
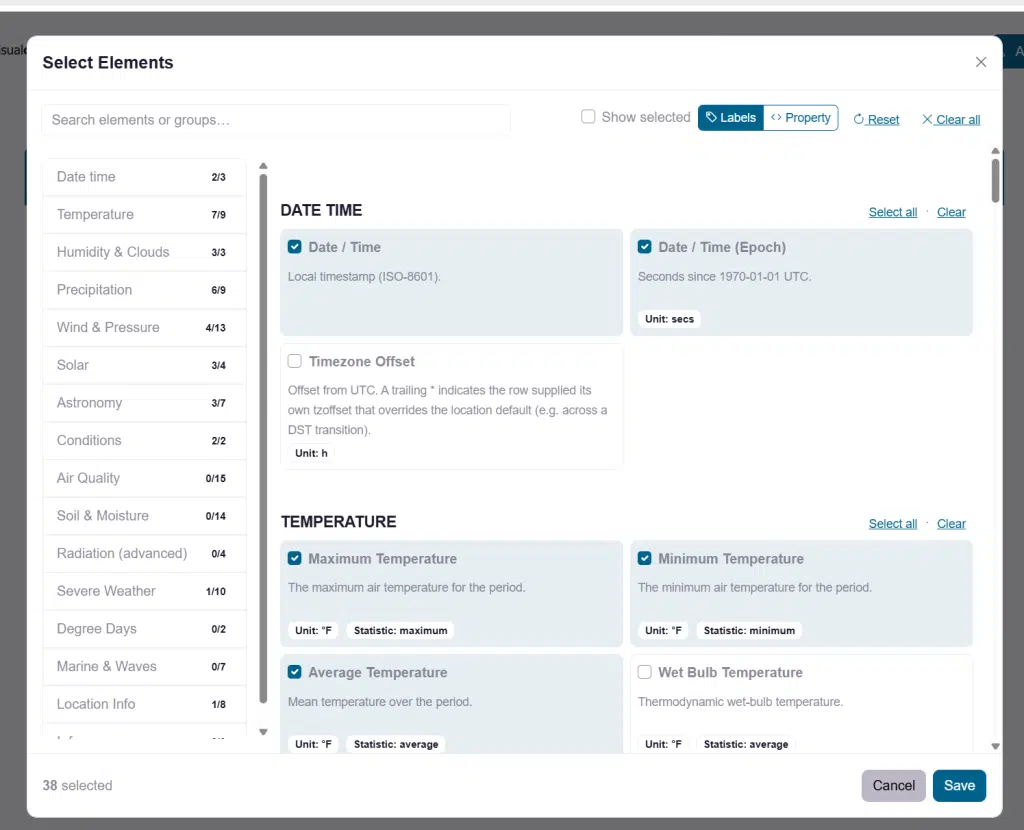
Here we can simply check/uncheck weather elements that we need. Be careful if you choose the ‘Clear’ option at the top as it will clear more than just what you see in the ‘Core weather elements’ section. Remember to scroll down and choose other columns of data such as our location columns and more.
Selecting additional Options
There are many pieces to choosing what data you want in your dataset and we will try to keep it simple with no selections here for this exercise, but please be aware of these options for future consideration:
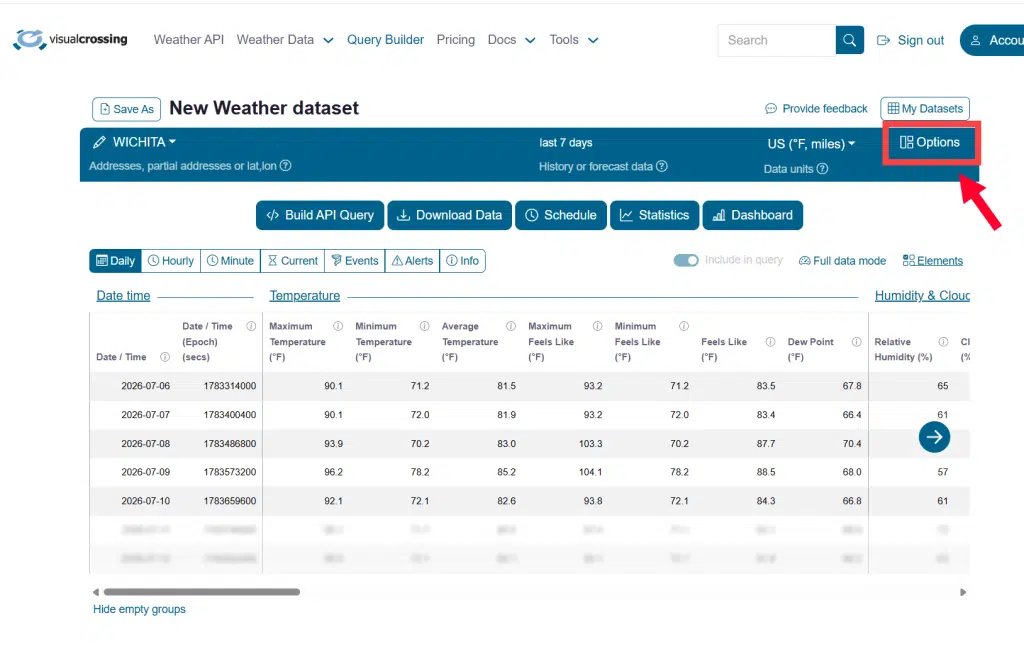
When opening this editor we can see addtional options. One of the most important areas of your data selection is the area to define station data. The Visual Crossing service is based upon a system of interpolation to give users a custom weather for their location. By default 3 stations are used to interpolate data for any position on earth. Users can define here how many stations are used, as well as how far our system can reach to use those stations. Rural locations may need to reach further than the defaults to retrieve data.
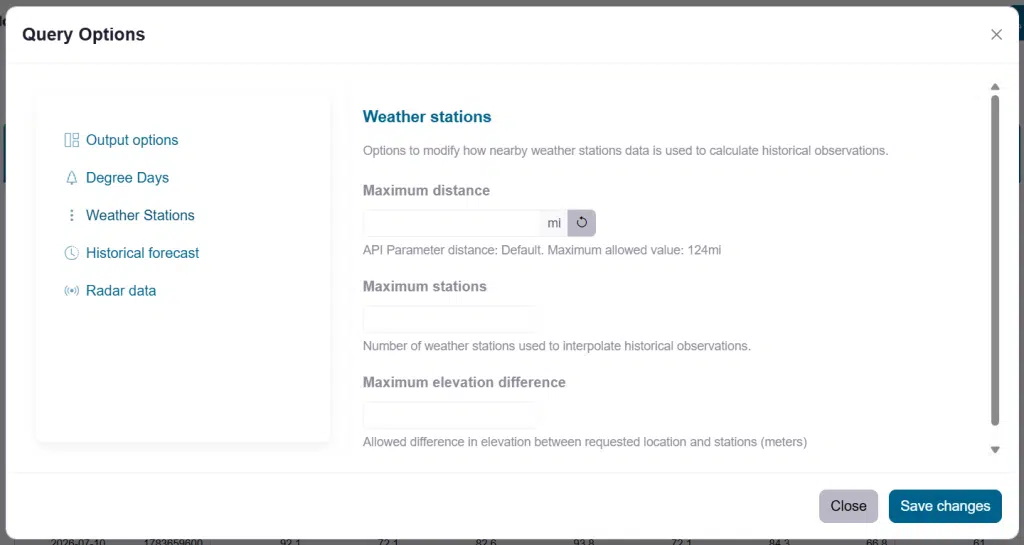
We are now done with our data selections and can click ‘Apply’ & ‘Continue’ to move onto our data exploration step.
Exploring the Weather Data
One of the great values of the Query Builder interface is the ability to see your data before you run queries or download it. It will update the data grid view in live fashion as you make the above changes step by step.
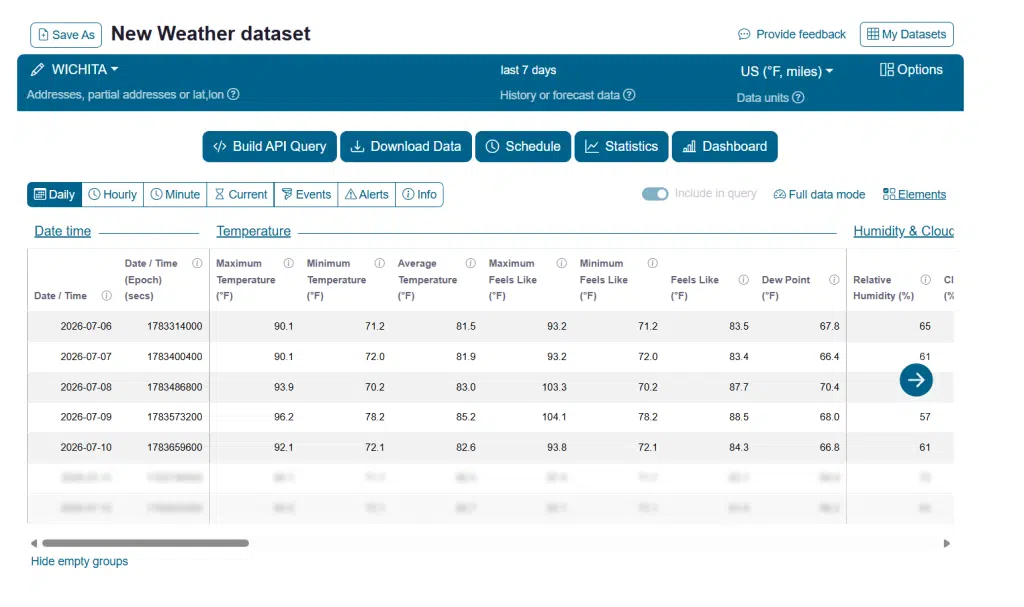
If everything is as you need it to be you can continue and click on the “Download Data” button to begin your export. Remember if you are just using Query Builder to extract a RESTful web URL to query programmatically you can copy that string from the “Build API Query” button.
Download the Weather Dataset
Finally we are ready to download our dataset! The Download step’s primary job is to confirm your data format, run the actual data query and let you download the data directly in your browser OR set up schedule which we will discuss separately.
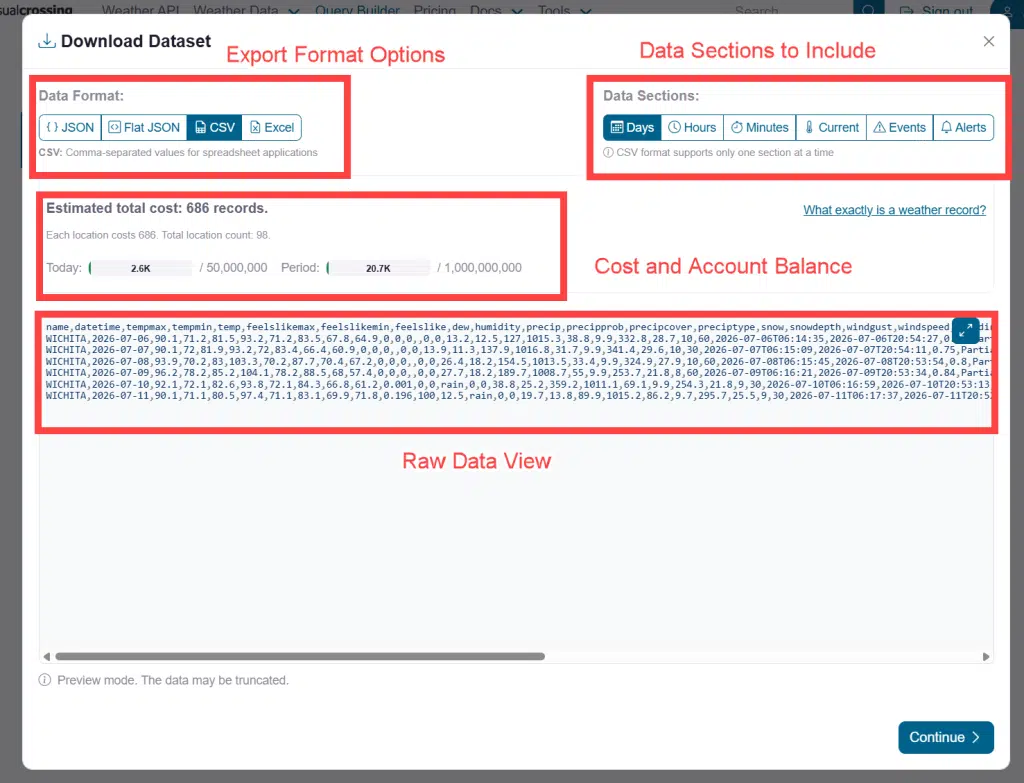
The first section of the export/download is to choose your Export Format options:
- JSON – This is the most flexible and can contain all data sections in a single dataset. However it does require a programmatic ability to parse the structures and is typically done only via code/script.
- CSV – This is basically a flat grid of data separated by commas. It is very fast and easy to parse but can contain only one section of data such as “Hourly” data. It is very good at integrating into Excel and using as an ETL import in to databases.
- FlatJSON – This variation of JSON is designed for lightweight, fast implemenations of data queries typically by realtime applications where speed and size are a concern.
- Excel – This will product an actual Excel file but it is highly recommended to try CSV first as it is the most accurate and doesn’t have concerns about versioning of Excel files.
The second section contains the type of data you want in the download. Remember that CSV can only do one section at a time.
The third section of the export chooser is the cost of your query. Our data is available in records where a full 15-day forecast for 1 location is equal to 1 record. For history data and historical forecast data, each row of data is equal to one record. We will show you an estimate for this query you are building and show you your account values. Our Free and our Metered Plans allow for 1000 free records per day. You can visit our Pricing page for the exact limits on each plan
Finally, if you are ok with the purchase click on the ‘Continue’ button and the system will ask you for a name for your dataset so that you can access the definition of the download later. Please note that it does not permanently save your data for you to re-download later. This is a short-term state to allow you time to download the data. Typically all new runs of the same query will be billed each time. Be sure to save your datasets locally.
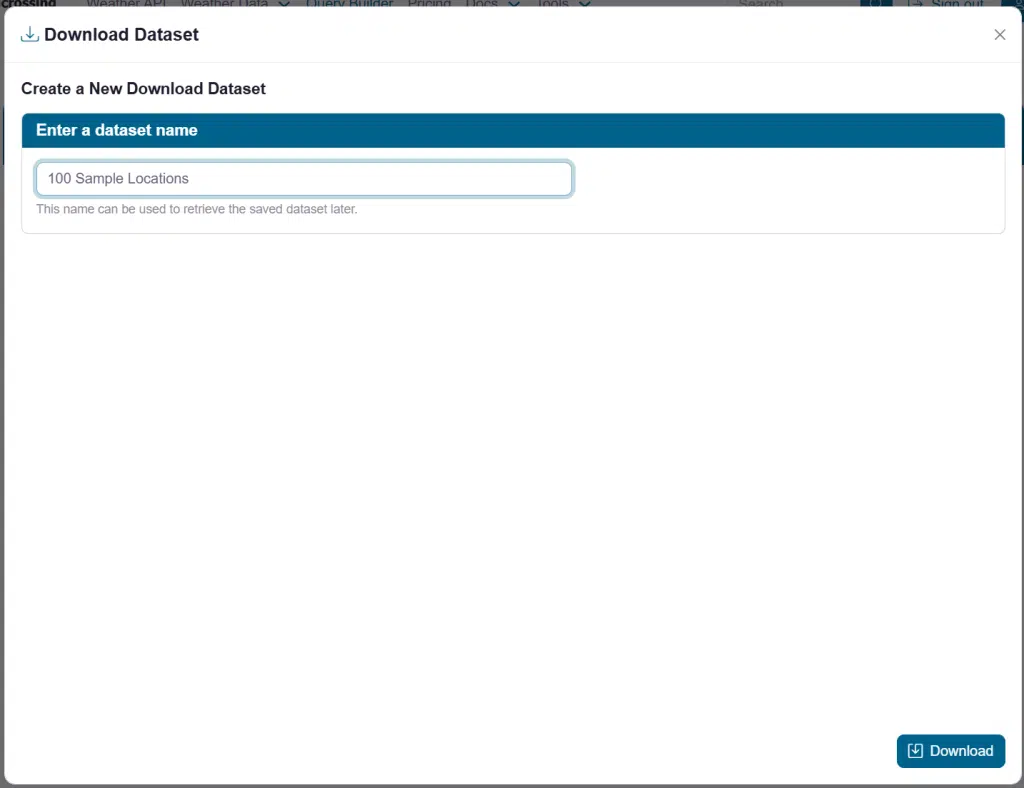
Clicking on ‘Download’ will start the query execution and show you the steps and state of your query. When complete you will see the following:
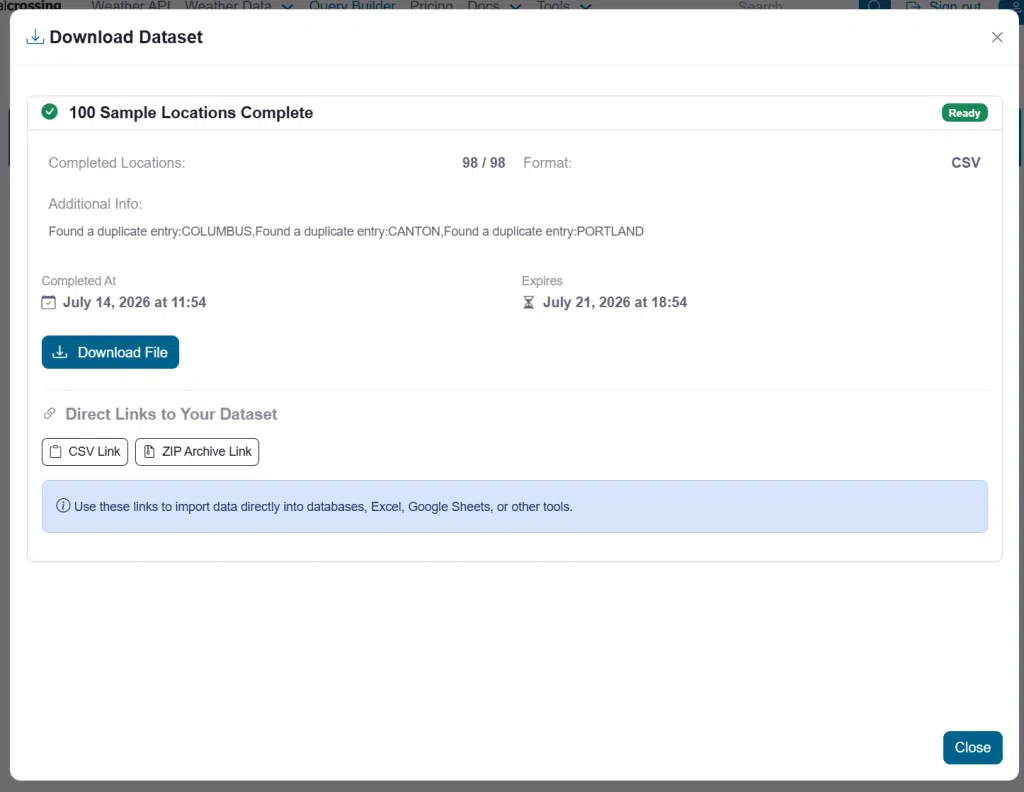
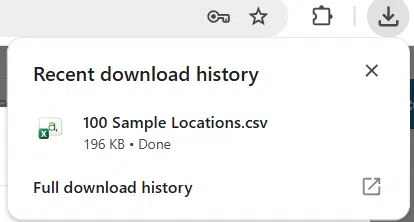
Clicking on the ‘Download File’ button and the dataset will download our CSV file of weather data directly into the download section of our browser as seen above.
NOTE: Browsers will download to different areas of the screen so make sure you know where your browser puts downloaded files. Also note, that certain security levels may not allow this operation without your permissions.
At the bottom of this section are URL links directly to your dataset. The links are only available after the query has completed.
As long as the dataset exists in the system you can use these links to directly access your file dataset. More on this below in the ‘MyDatasets’ section.
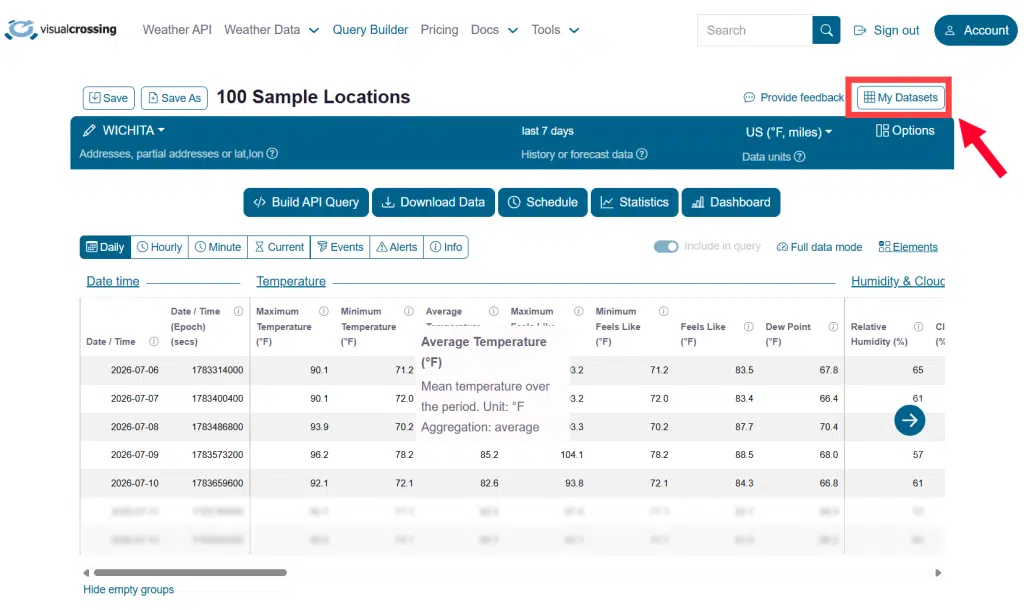
You should now have your dataset both downloaded from your browser to your local filesystem as well as in your MyDatasets page.
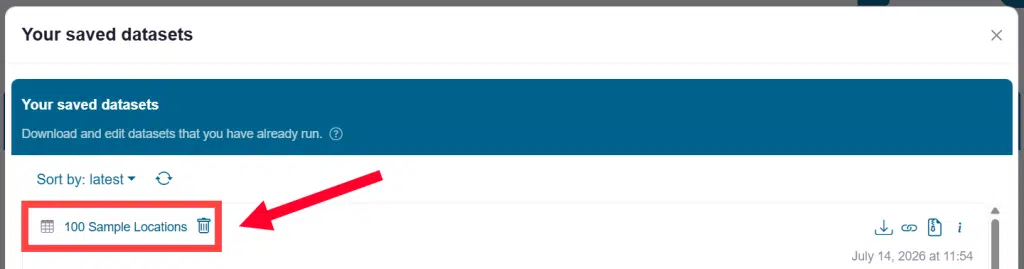
This is the location for all data that you have downloaded, but do note that datasets have a limited lifespan and will be removed based upon space and time. However, if you schedule datasets or want to re-download a recent dataset, you can do so from this section.
Also note that you can find URL links to this data set for use in Weather Workbooks or other applications that wish to stream the file contents directly using we Web URL.
Create a weather data schedule
One of the most powerful aspects of the ability to build a standalone dataset package is that you can schedule new versions of any dataset to be created daily. Your URL links will always point to the latest so any application that accesses these scheduled sets simply have to refresh the data to get the latest version.
Here is a document that will give you more information about how to set up a scheduled dataset.
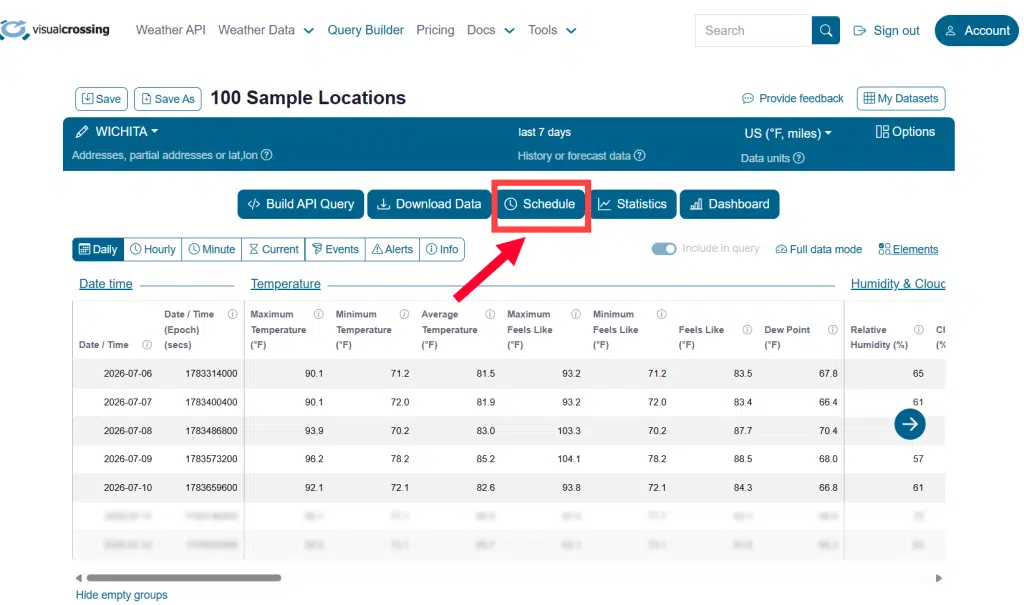
The primary difference from your download that you completed above is that you will choose the ‘Schedule’ button rather than teh download. You can also go back to the definition you just created and choose the ‘Schedule’ button . The link to the scheduled datasets in ‘My Datasets’ will always point to the latest run
Congratulations, you have now completed the creation of your first weather dataset! Please let us know if you have any additional questions at our Support Page