
There are several options available to add historical weather data sets as well as weather forecast or typical weather. Directly from a Visual Crossing Map as a layer, as dynamic cube or directly into your RDBMS data warehouse.
This tutorial provides step by step instructions for the first two options. For the direct load into your relational database please refer to the How to load historical weather data into any database tutorial.
Option A: Loading Weather data into an dynamic cube
Step 1 generate the API Query string
Besides the possibility to put together the REST query string manually (See API documentation for details) you can have the query string being generated automatically in the WebGUI.
Once you logged into your account and entered your locations of interest (for details see as well the Getting Started With Weather Data Services guide under ‘Retrieving our first weather data‘ )
Once you added your locations you can enter the parameters for your query. Forecast, Historical Weather or Historical Summaries as well as the time interval (day, day-night, hourly, sub-hourly, business hours, date range…).
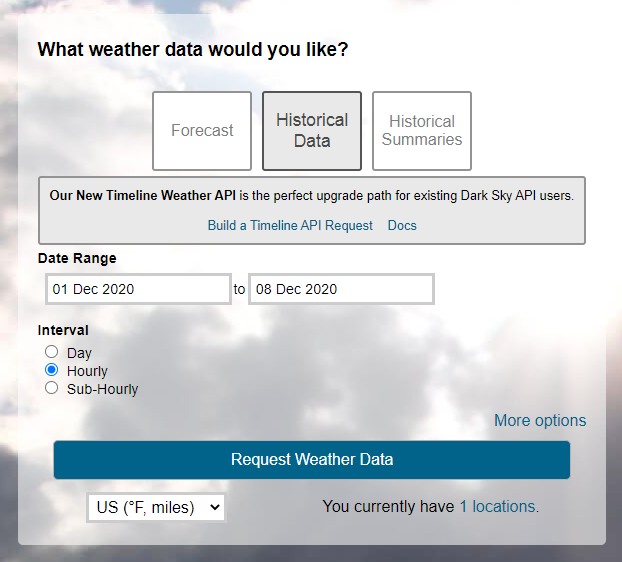
After hitting the “Request Weather Data” button you will retrieve the result in calendar view.
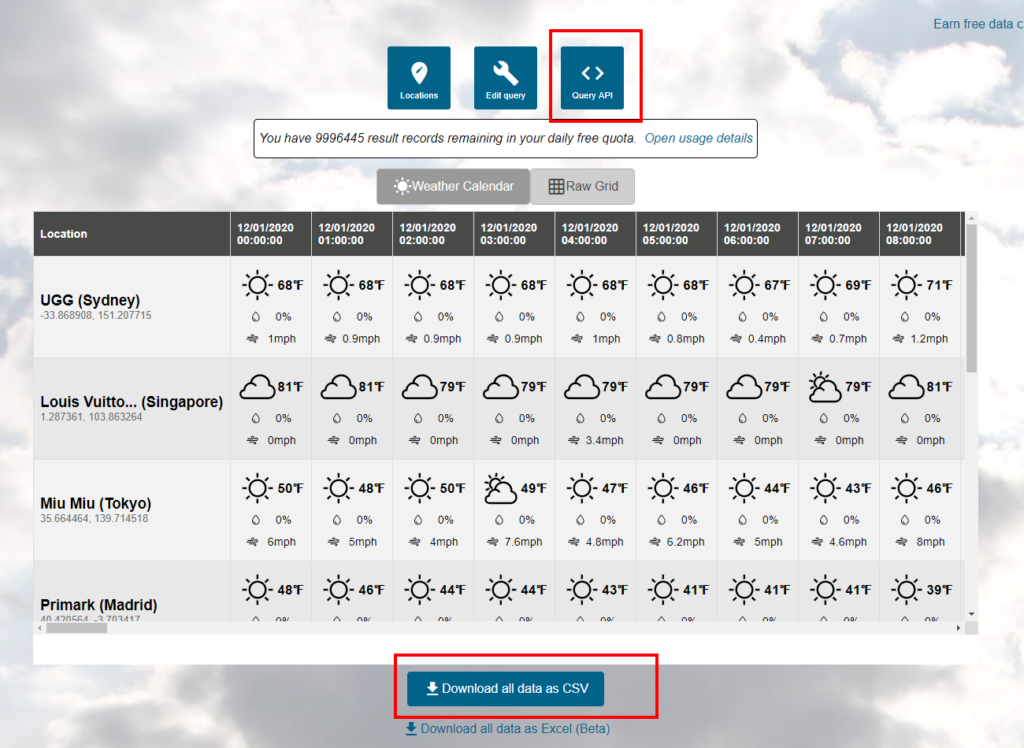
Besides the opportunity to download the data directly as csv or Excel file you can hit the “Query API” button as well which will take you to the query string editor.
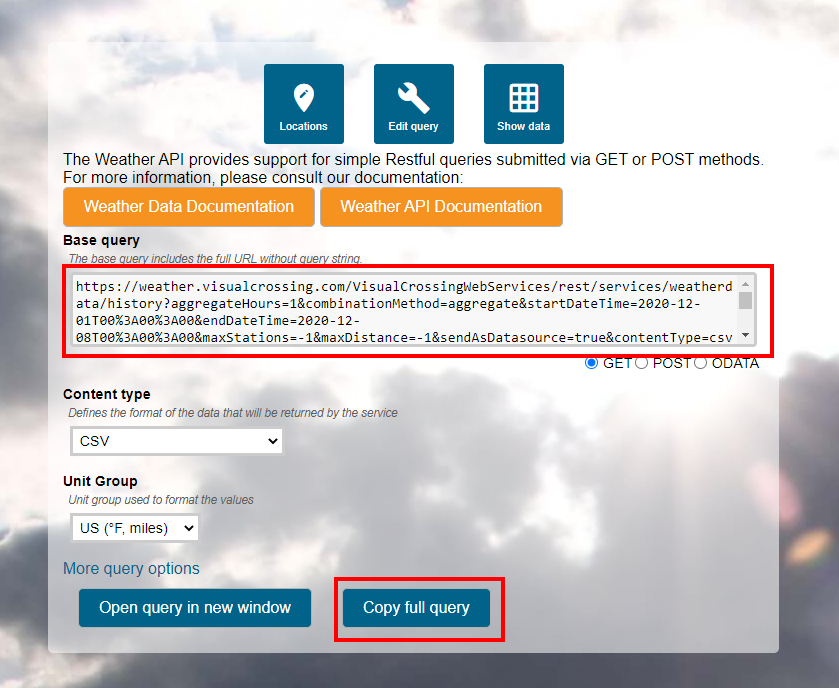
For MicroStrategy cubes check the “GET” option and select the “CSV” entry from the “Content type” drop down menu
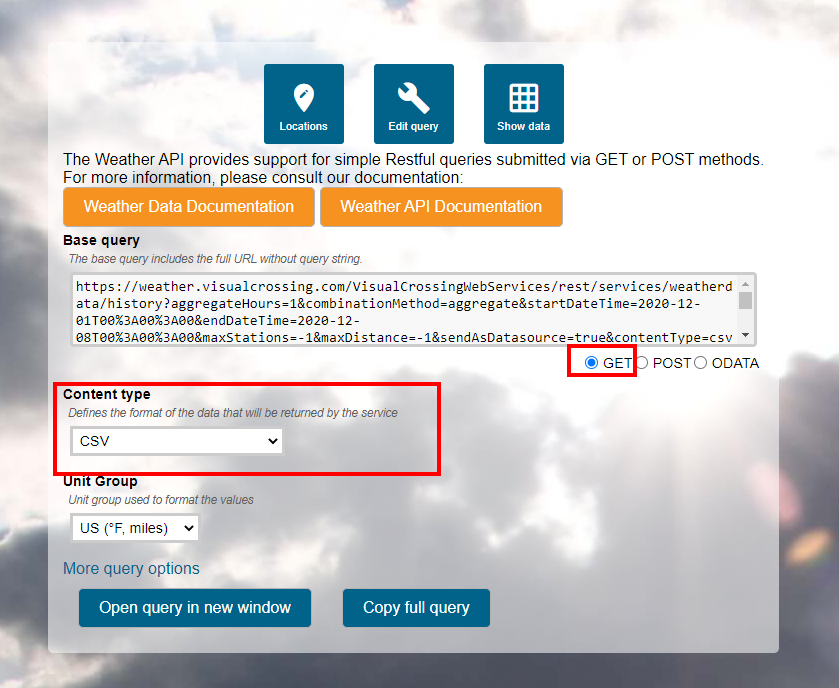
The “Base query” section will show the query string now which can be copied to the clipboard by clicking the “Copy full query” button.
Step 2 define the MicroStrategy cube based on the generated query string
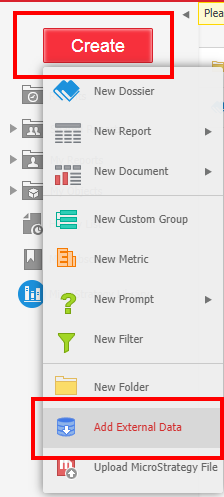
In your MicroStrategy web interface hit the “Create” button and select the “Add External Data” option
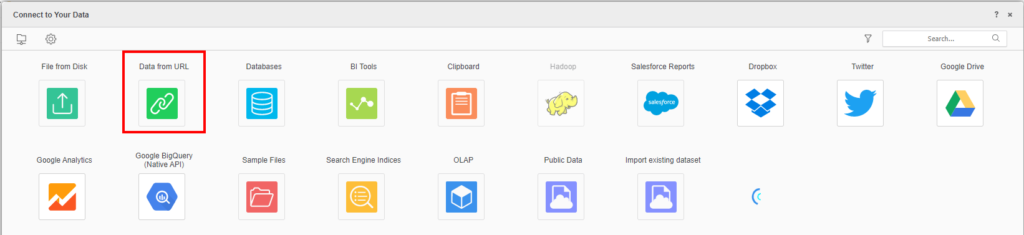
This will open the “Connect to Your Data” dialogue where we select the “Data from URL” option.
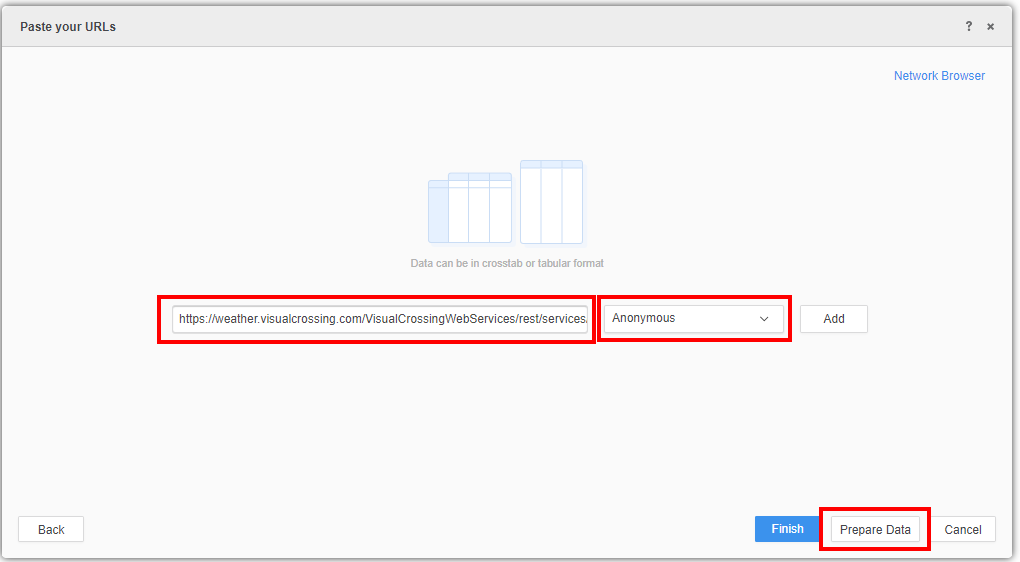
In the “Paste your URLs” window copy the query string generated in Step 1 to the corresponding form filed, make sure the connection authentication is set to “Anonymous” (your API key is already encoded in the query string) and hit the “Prepare Data” button.
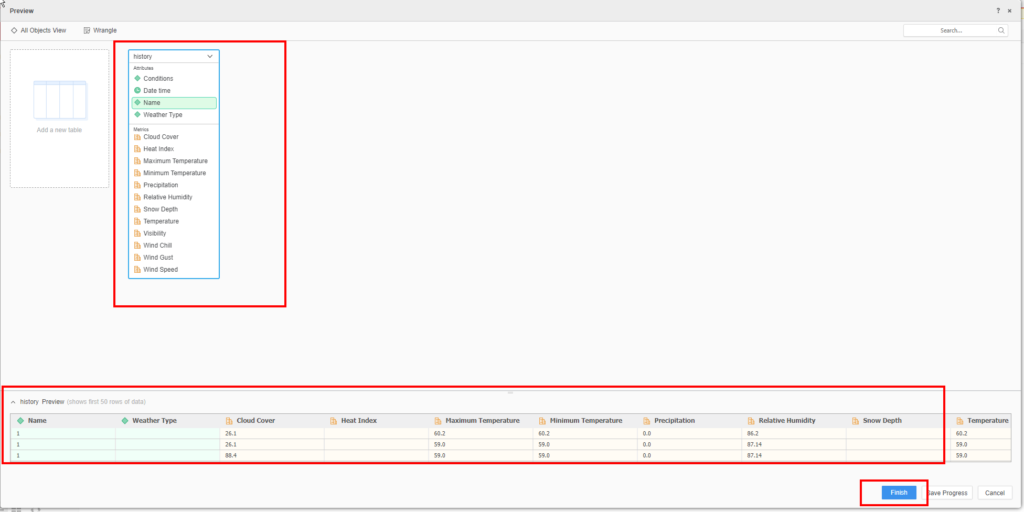
Review the data /-structure and click the finish button to save the cube.
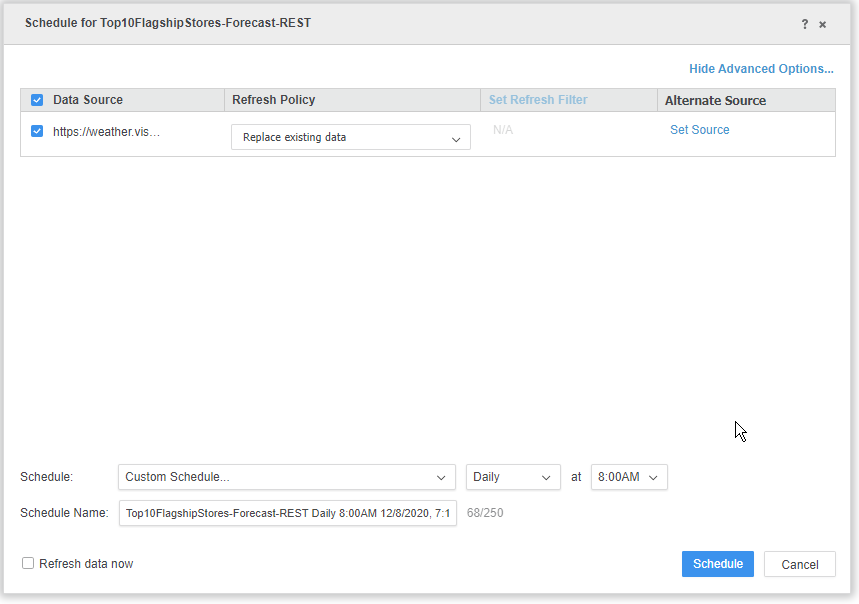
NOTE – in case you are analyzing forecast data a refresh schedule is recommendable.
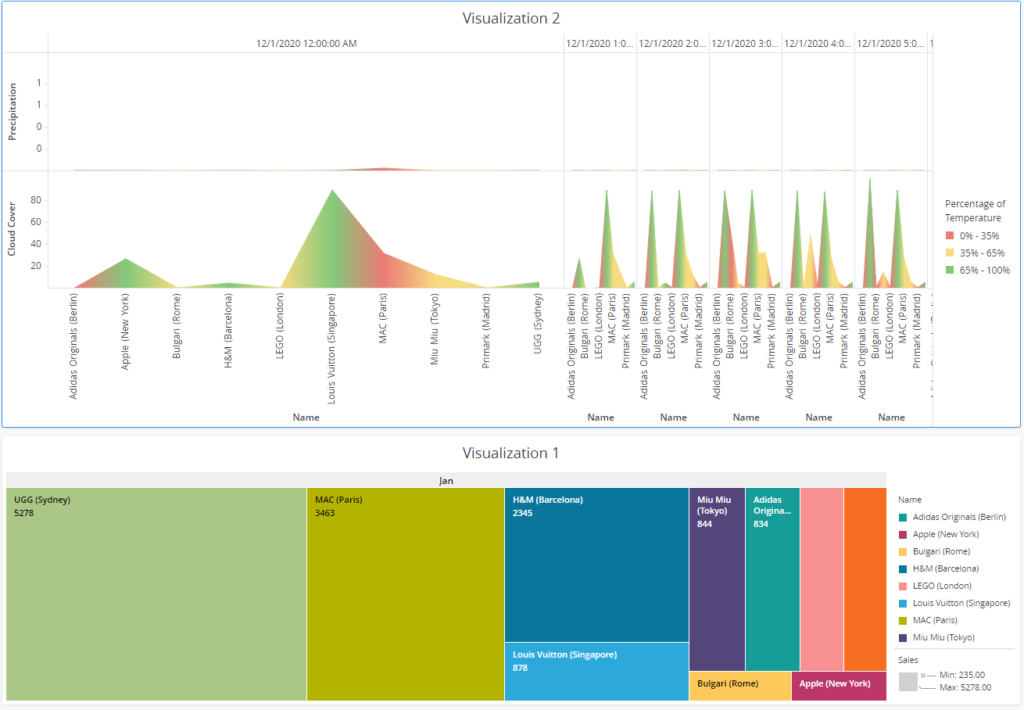
Start Analyzing your business data joined to the weather information.
Option B: Loading Weather data as a layer in a Visual Crossing Map
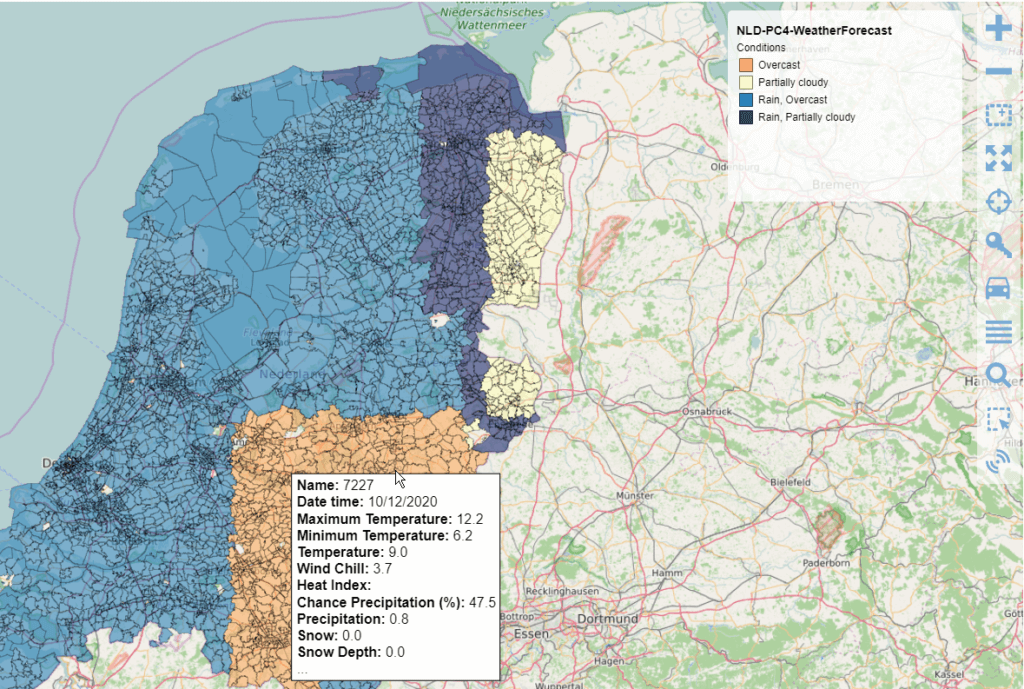
In case you are running the Visual Crossing Geo Analytics Widget you can add weather data directly as a layer onto your map as well. Besides single location weather information Visual Crossing provides the data aggregated as well to standard geographic entities like postal codes. For this tutorial we will select this option.
Step 1 copy the location URL for the bulk data set of interest
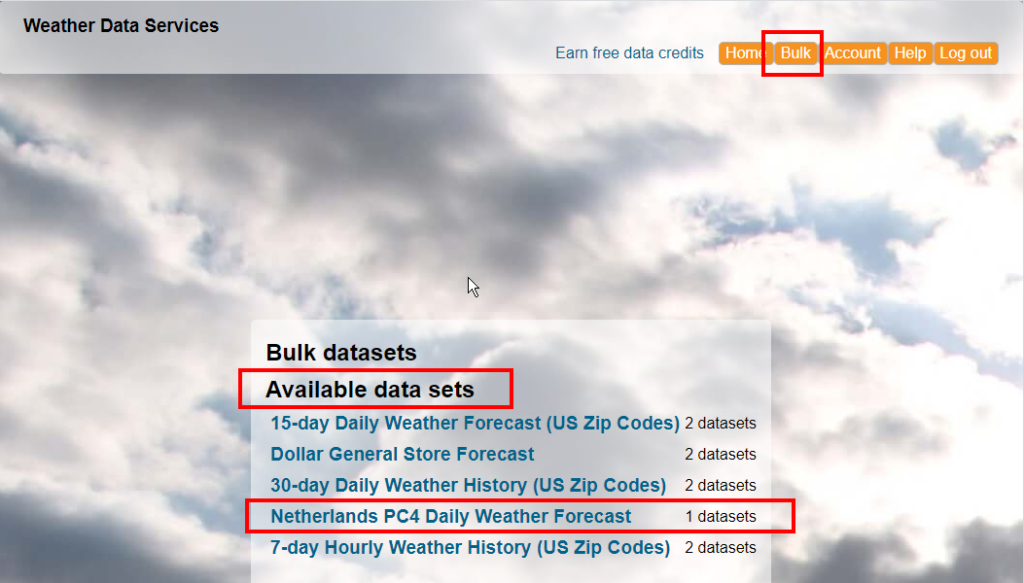
Once logged in into your Visual Crossing Weather account you will see a button ‘Bulk’ in the upper right corner of the site.
This will bring you to a list of available bulk datasets. There are more available on request and additional ones can be generated as well.
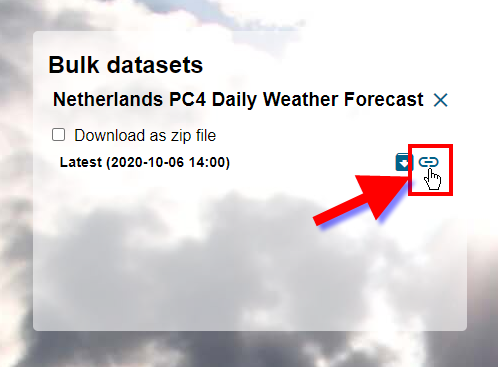
To get the URL simply click the data set of interest.
On the following screen click the “Copy Link” icon
Step 2 define a table data layer in Visual Crossing Map widget
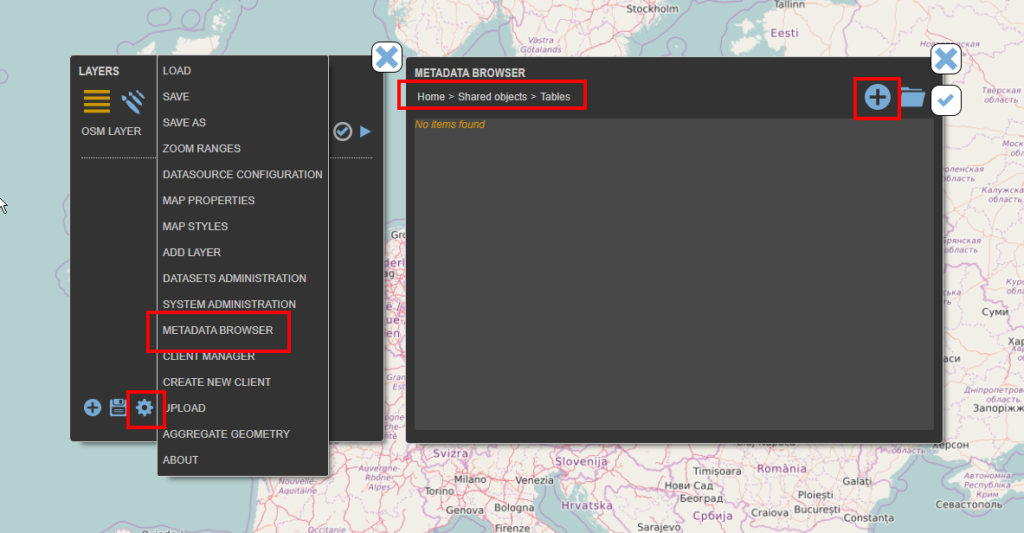
From the “Settings” menu select the “Metadata Browser” entry and navigate in the opening dialogue to the “Tables” folder.
Click the “Add” button
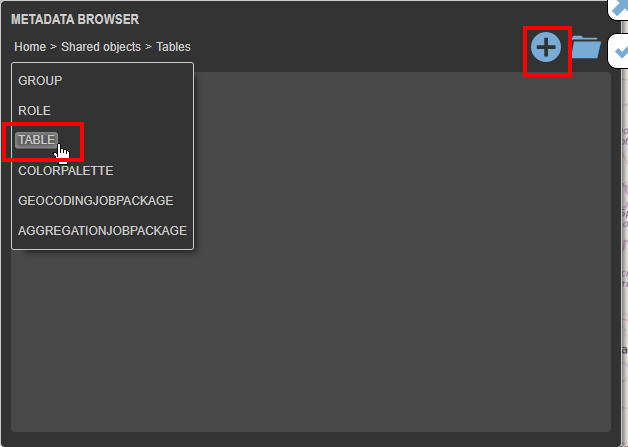
Select the “Table” entry from the pop up list
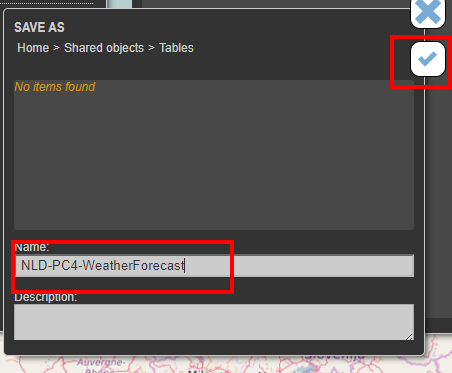
Enter a name and click the “check mark” icon
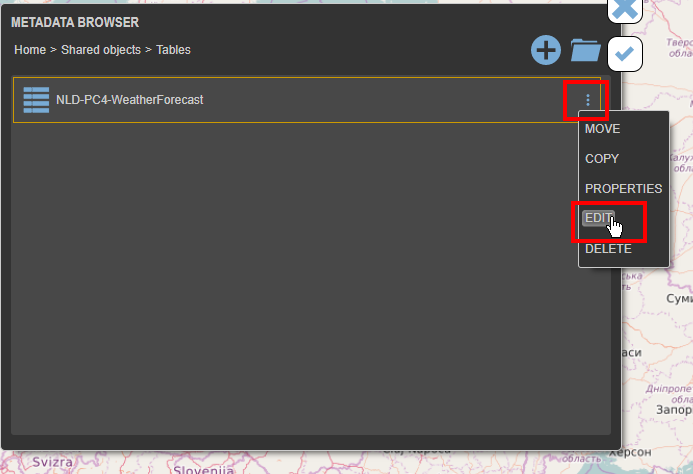
On the new list entry select the “Edit” entry from the “More” menu
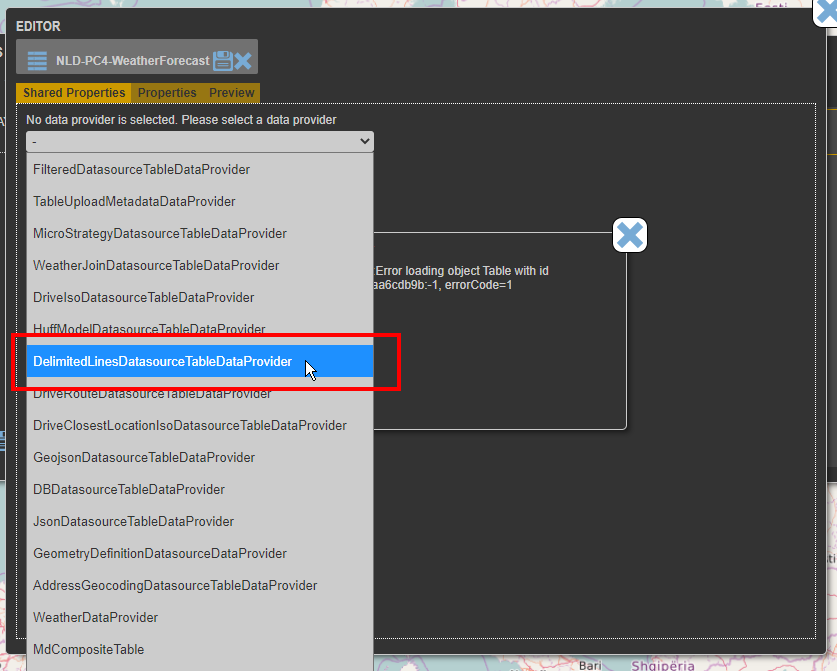
The first step in the table “Editor” is to select the data provider. In our case this is the
“DelimitedLinesDatasourceTableDataProvider”
In the “Properties” tab paste the URL you generated in Step 1 of this section into the “Data uri” field
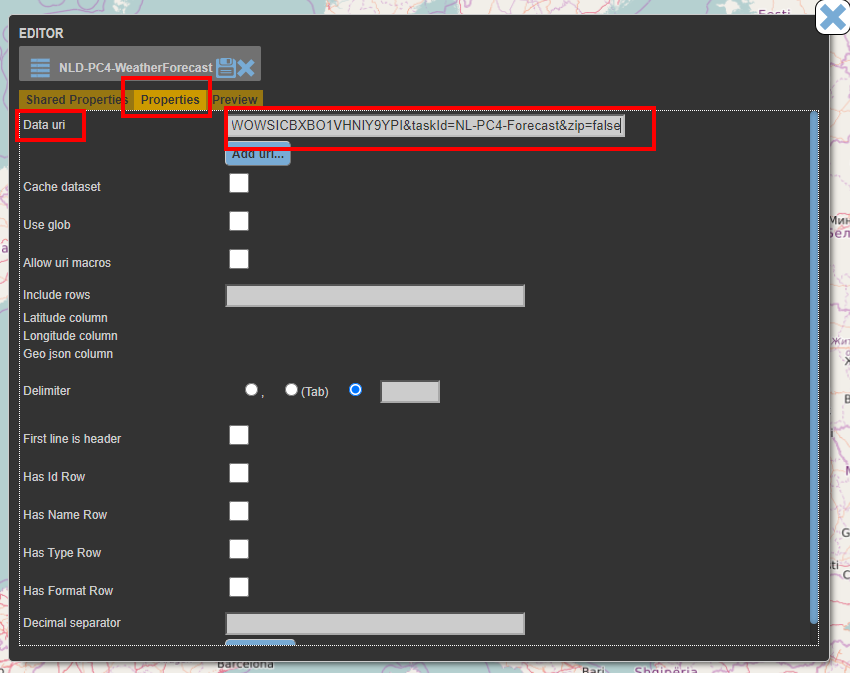
NOTE: Make sure the “cache dataset” option is unchecked in case you are asking for forecast data to make sure the layer is refreshed automatically.
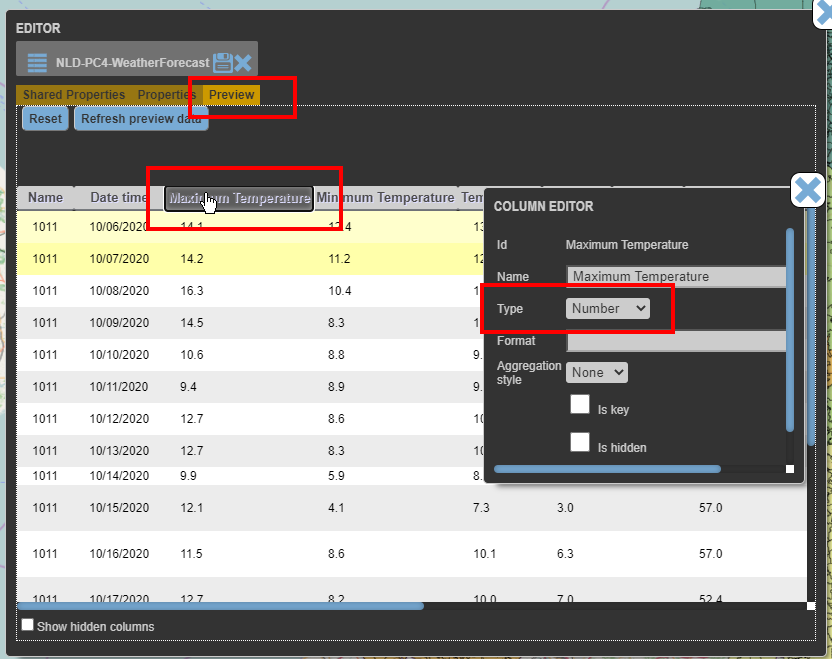
In the Preview tab define the data types for those columns you are interested in by simply clicking the column name and setting the parameters
Step 3 set the geometry for your added weather data
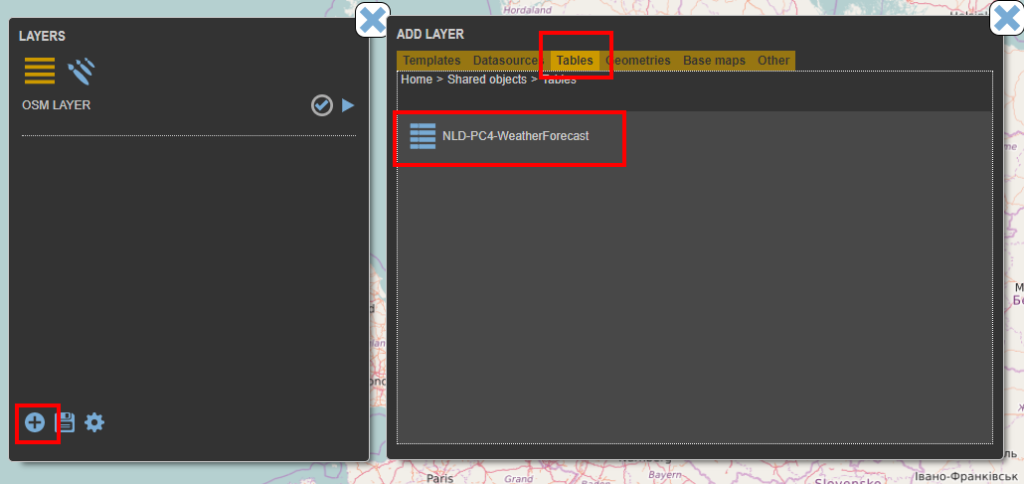
To define the corresponding geographical entity belonging to your weather data add the new layer to a map by clicking the ‘Add Layer’ button and select your newly under Step 2 defined layer from the “Table” tab
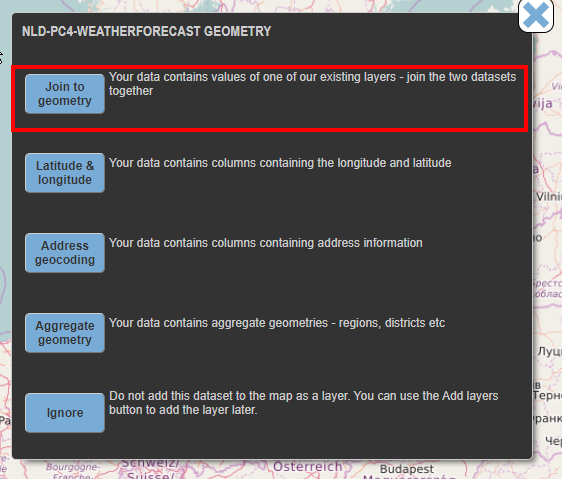
Once loaded you will be prompted to select the type of geometry your data corresponds to. This can be an existing geographical data set, Latitude/Longitude values or and address lookup as well.
In our case we select the “Join to Geometry” option since we have the Dutch Postal Code areas already as geometry in the system
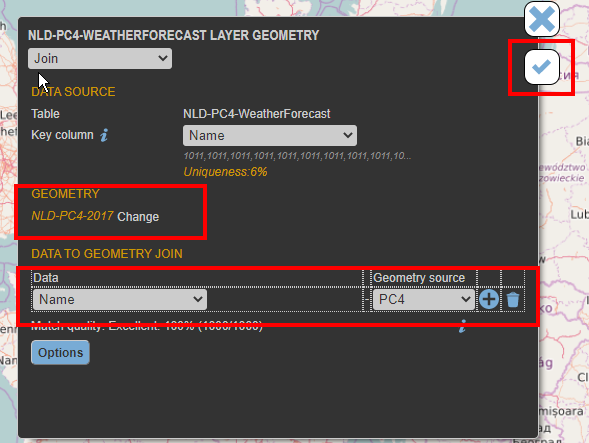
finish the geometry definition in the Layer Geometry Editor and click the ceckmark – for details please see the documentation of Geometry definition in the maps section of our help center
Step 4 configure your map layer as usual in addition to your business data
The new weather layer can be used as usual in any business context to give additional insight to your business. All configuration options are available in this context. For details of map configuration like formatting, animation, filtering etc, please refer to the corresponding documentation on our help center.