

In this article we are going to create a simple web app that displays weather data using the Visual Crossing Timeline Weather API. The output will be a simple HTML page that displays daily and hourly weather history data or weather forecast data (or even beyond) in a table.
To download the source code for this sample and many other JavaScript, Java and other languages, see our repository at https://github.com/visualcrossing/WeatherApi/blob/master/Nodejs/SimpleWeatherApp/main.js
The output is very simple – just a plain, vanilla HTML table to keep the focus on the steps to read and process the weather data.
Step one – sign up for the Weather API to get your free API key
Before we write our script, let’s take a look at a sample Timeline API call to retrieve the weather forecast for ‘New York City,NY’ in the USA. The call is very simple – include the encoded location in the path and then add your API key to the key parameter.
https://weather.visualcrossing.com/VisualCrossingWebServices/rest/services/timeline/New%20York%20City%2CNY?unitGroup=us&key=YOUR_API_KEY
In the above query, we ask for the weather forecast for New York City. We can also request weather data for particular dates:
https://weather.visualcrossing.com/VisualCrossingWebServices/rest/services/timeline/New%20York%20City%2CNY/2020-1-1/2020-1-10?unitGroup=us&key=YOUR_API_KEY
In this case, we will retrieve weather data for the January 1st to January 10th 2020. The API will automatically determine if you historical weather data, weather forecast data or even statistical forecast data when you request for a data in the future beyond the current forecast.
If you don’t have an API key yet, head over to Visual Crossing Weather Data Services to sign up for you free account – you will be able to make up to 1000 requests for free every day. You can also create Timeline API requests interactively directly within the tool and explore the JSON output.
Step two – write our Node.js shell application
We are now ready to create our Node.js application. In this simple case, we are going to create a single page that responds to http requests. To create the app, make sure you have Node.js installed and configured and create a new directory where Node.js is installed. In my case, I’ve created a folder called ‘weatherapi’.
Then open a command line console and navigate to the directory. Then execute the command:
> npm init --yes
This will create a default package.json within the directory.
Now create a new text file in the directory called ‘main.js’ and open it in your favourite text editor.
In your text file, add the following. Note that you should replace YOUR_API_KEY with your actual key obtained when signing up in step one above.
"use strict";
const http = require("http");
const url = require("url");
const https = require('https');


const API_KEY = 'YOUR_API_KEY';
const UNIT_GROUP="us";

http.createServer(function (request, response) {


   const queryObject = url.parse(request.url,true).query;
   response.writeHead(200, {'Content-Type': 'text/html'});
   if (!queryObject.location) {
 response.end(`Please include a location query parameter`);
 return;
   }

   response.end(`Weather data will appear here!`);

}).listen(8081);

// Console will print the message
console.log('Server running at http://127.0.0.1:8081/');
This code sets up the required libraries (http, https and url). Then specifies two constants – your API key and the unit group that you would like to work in. The unit group defines the units of measurement we will use in the weather data such as US (degrees Fahrenheit, inches of rain etc) vs metric (degrees celsius, mm of rain etc).
Finally the code creates a simple HTTP server to respond to a browser request for data. We parse the incoming URL to extract parameters (see step three) and then respond with some static text.
You can run the script using the command:
> node main.js
And if you open a browser on the same machine and enter ”http://127.0.0.1:8081/?location=New%20York%20City,NY’ into the browser you should receive the message:
Weather data will appear here!
If you successfully see the message, you are ready to retrieve some real weather data!
Step three – retrieve the weather data from the weather api
To retrieve the weather data, we will construct the URL from the parameters – the location, the optional start data and the optional end date:
const retrieveWeatherData = function (location, start, end) {

    var requestUrl = https://weather.visualcrossing.com/VisualCrossingWebServices/rest/services/timeline/${encodeURIComponent(location)};
     if (start) requestUrl+=/${start};
     if (start && end) requestUrl+=/${end};
 requestUrl+=`?unitGroup=${UNIT_GROUP}&key=${API_KEY}`;
 ...

}
All the weather requests require the location, the unit group. If the start date is specified, then that is added to the URL and if both a start and end date are specified, the start and end date are appended to the request. Start and end dates are specified in yyyy-MM-dd format such as 2020-07-11 for 11th July, 2020.
We can request the data. Note that this is a https endpoint and so we use the https library. Most of the following code is various stages of error handling – the main part of the code is parsing the weather data JSON (JSON.parse(rawData))
	return new Promise(function(resolve, reject) {
		https.get(requestUrl, function (res) {
		  var statusCode= res.statusCode;
		  const contentType = res.headers['content-type'];

		  var error;
		  if (statusCode !== 200) {
			error = `Request Failed. Status Code: ${statusCode}`;
		  } else if (!/^application\/json/.test(contentType)) {
			error = `Invalid content-type. Expected application/json but received ${contentType}`;
			statusCode=500;
		  }

		  res.setEncoding('utf8');
		  let rawData = '';
		  res.on('data', (chunk) => { rawData += chunk; });
		  res.on('end', () => {
			try {

				if (error) {
					console.error(`Error: ${error}. Details: ${rawData}`);
					reject(`Error: ${error}. Details: ${rawData}`);
				} else {
					resolve(JSON.parse(rawData));
				}


			} catch (e) {
			  console.error(`Unexpected error ${e.message}`);
			  reject(`Unexpected error ${e.message}`);
			}
		  });
		}).on('error', (e) => {
			console.error(`Error 3 ${e}`);;
			 reject(`Communication error ${e}`);
		});

	});
We also modify our main server function to retrieve the weather data:
 retrieveWeatherData(queryObject.location, queryObject.start,queryObject.end).then(function(data) {

 response.end(`<html><body>${buildWeatherTable(data)}</body></html>`);

}).catch(function(data) {
 response.end(`<html><body>${data}</body></html>`);
});
We can now enter the full URL into a browser to retrieve the weather data. The start and end parameters are optional.
http://127.0.0.1:8081/?location=New%20York%20City,NY&start=2020-02-01&end=2020-03-1
There is just one last step – to create the HTML table of weather data.
Step four – format the weather data as an HTML table
Our final step is to create the method hinted at above ‘buildWeatherTable’. This function creates a very simple HTML table using the weather data we have requested.
The weather data is structured as an array of weather data objects for each day we have requested. In addition, for historical weather data and weather forecast days, within each day is an array of weather objects for each hour. For full details, see the Timeline API documentation.
We can therefore loop through each day and hour and add a row to our table:
const buildWeatherTable= function (weatherData) {
if (!weatherData || !weatherData.days) {
return "<h3>Unexpected weather data</h1>";
}
var html=`<h1>Weather Data for ${weatherData.resolvedAddress}`;
html+=`<table>`;
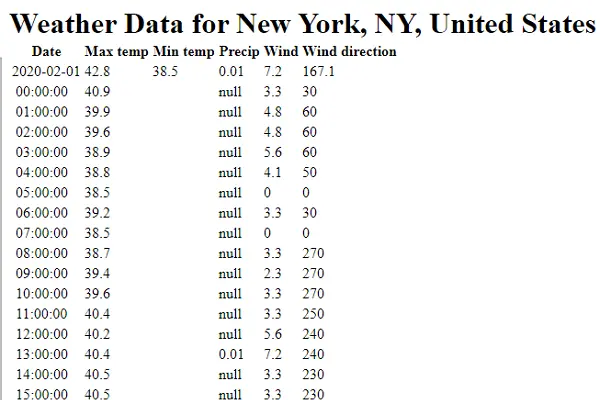
html+=`<tr><th>Date</th><th>Max temp</th><th>Min temp</th><th>Precip</th><th>Wind</th><th>Wind direction</th></tr>`;
weatherData.days.forEach(function(day) {
html+=`<tr><td>${day.datetime}</td><td>${day.tempmax}</td><td>${day.tempmin}</td><td>${day.precip}</td><td>${day.windspeed}</td><td>${day.winddir}</td></tr>`;
if (day.hours) {
day.hours.forEach(function(hour) {
html+=`<tr><td> ${hour.datetime}</td><td colspan="2">${hour.temp}</td><td>${hour.precip}</td><td>${hour.windspeed}</td><td>${hour.winddir}</td></tr>`;
});
}
});
html+=`</table>`;
return html;
}
Now when we refresh our browser, we should see a table of weather data in the browser.
Questions or need help?
If you have a question or need help, please post on our actively monitored forum for the fastest replies. You can also contact our Support Team.