

Historical precipitation data is an important weather measure that is very useful for many types of personal analyses and business use cases. Whether you are looking for precipitation data to plan a trip, schedule a conference, or optimize agriculture, a weather data service such as Visual Crossing Weather can provide precipitation data easily using global historical reports going back to 1970.
What precipitation measures are available?
There are several important precipitation measures. These include Precipitation itself, Precipitation Coverage, Snow, Snow Depth, and Hail. Precipitation is the total amount of precipitation of any type that fell during the period. This value includes not only the amount of rain but also the amount of snow and any other non-liquid precipitation. In the case of non-liquid precipitation, the value is reported as if it were converted into water.
Precipitation coverage is a useful value that tells the length of time during the reporting period that precipitation occurred. It is always expressed as a percentage of the total time in the reporting period. For example, if it rained for 6 hours during a day-long reporting period, the precipitation coverage value for that daily weather record would be 25% (6 hours out of 24 total). There are many valuable ways to use precipitation coverage, and you can read more about them in our article devoted to this specific weather measure.
Snow and snow depth are related in that they both deal with snow. The first measure, snow, tells how much fresh snow fell from the sky during the reporting period. The snow depth measure tells how much snow is currently on the ground in areas that have not be plowed or piled. Remember that these metrics can interact in ways that are not always obvious. For example, sometimes snow falls on warm ground and doesn’t accumulate at all in spite of plenty falling from the sky. At other times when it is very cold, snow can remain on the ground for weeks or months after the last flake fell.
The Visual Crossing Weather API also offers hail data. However, due to the nature of hail data, the use is somewhat different than that of the standard weather measures described above. For more information, see our article on extreme weather including hail.
What are the units and range for historical precipitation data?
Precipitation, snow, and snow depth are provided in inches in you request the standard unit system. When using metric, precipitation is given in millimeters while snow and snow depth are given in centimeters. Precipitation coverage is given as a percentage of the total timespan of the weather record as mentioned above. As for range, the most rain recorded in a single day was nearly 72 inches (1828 mm) on the French island of Réunion due to a tropical cyclone. For snow extremes a town of Capracotta, Italy received over 100 fresh inches (254 cm) during a single day (although some news sources dispute the veracity of that claim). As for extremes on the low-end, many places on earth get less one one inch of precipitation per year and even more can go many months without any rain. The driest place on Earth, according to the Guinness Book of World Records is a Quillagua, a small town in Chile. It can get less than one one-hundredth of an inch (0.25 mm) in a year. And, of course, there are many places that never get snow.
How can I find precipitation data for a specific location and date (or date range)?
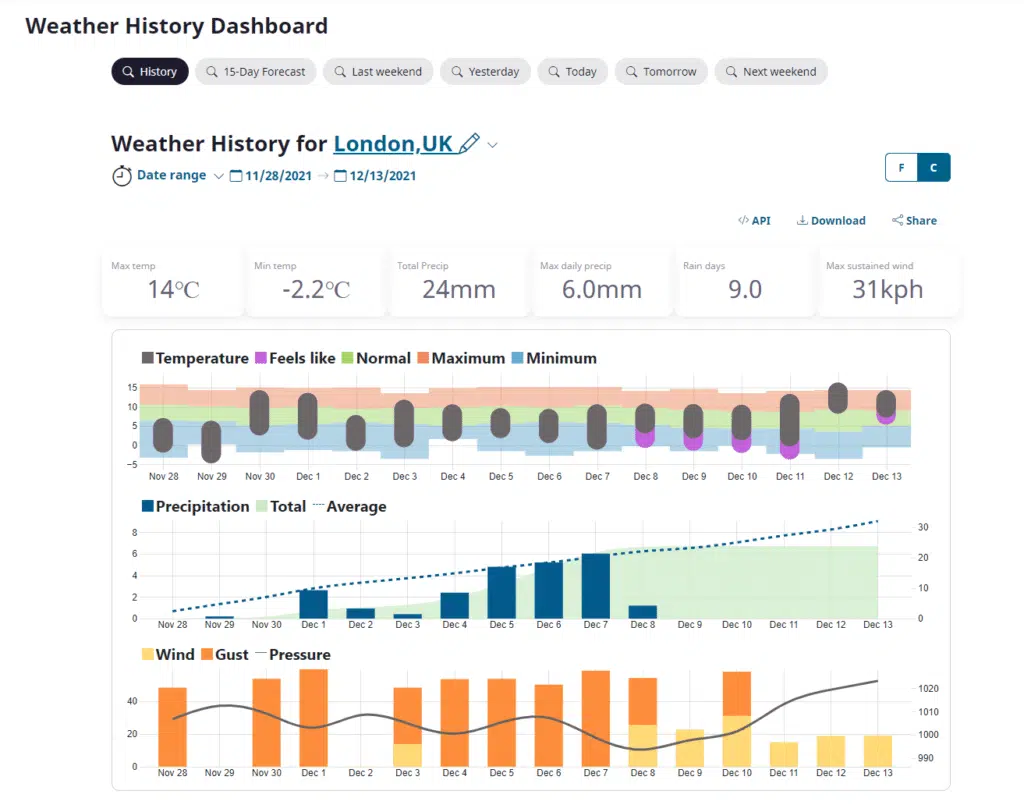
Visual Crossing Weather offers several ways to find the precipitation measures for a specific location and date. The easiest option is to use the free Weather History dashboard. Simply enter the location and date (or date range), and you will be able to see formatted page showing the weather details that you requested. The precipitation information is in the KPIs at the top and in the graph on the left-hand side in the middle. In this view only the basic precipitation data is provided. Specific snow data is not shown in the Weather History dashboard.
The second option is to use the Visual Crossing Weather query page to get the weather details. This is a great option if you would like to download the precipitation data as a CSV file or as an XSLX for loading directly into Excel. First, sign up for a free account on the weather query page if you don’t already have one. You can then enter your location, select the date range, and submit your historical weather query. After the query is run you can view the results directly on the webpage or download the results for further analysis.
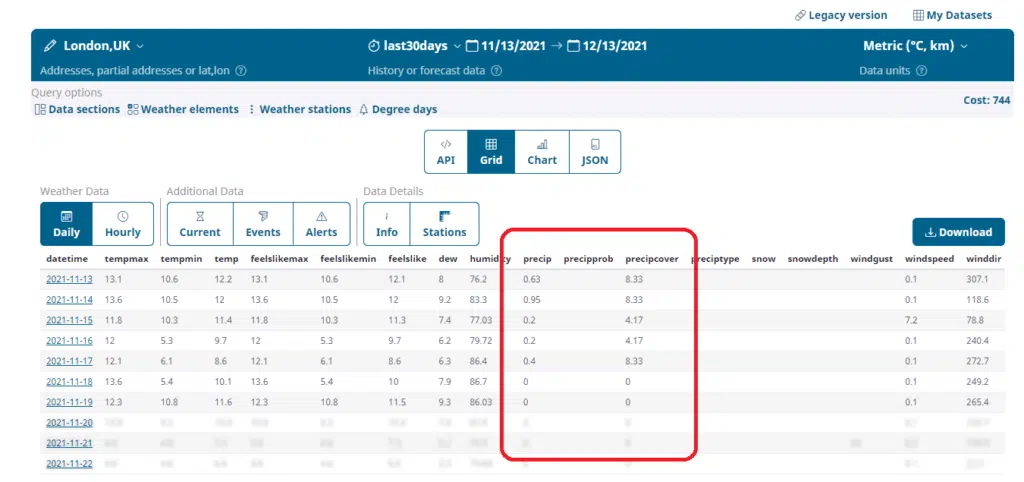
The third option is to run a query via the Visual Crossing Weather API. Using an API allows you to run your query from inside any script or code automatically. The Visual Crossing Weather API uses a simple query URL to define a weather query. You can run this URL in a command-line tool such cURL, in your own script or code, or even directly in a web browser. The query returns the weather results including precipitation data in CSV or JSON format. CSV results are easily loaded into a database or data science tool while JSON is a format that is easily parsed in languages such as Python and Java. If you follow our how-to guide, you can learn how to run your first weather API query in just a few minutes.
Summary
Precipitation along with its related weather measures is an historical weather measure that is very important for many purposes including scheduling, event planning, and agriculture. Using Visual Crossing Weather, it is easy to find historical precipitation data for any worldwide location in several convenient ways. From the free Historical Weather Dashboard, to the weather query page, to a fully embeddable weather API for your code, Visual Crossing weather makes finding precipitation data simple.
If you would like to learn more about precipitation data in Visual Crossing Weather, you can read more in our data documentation.
Questions or need help?
If you have a question or need help, please post on our actively monitored forum for the fastest replies. You can also contact our Support Team.