

How to make intelligent decisions using BI and weather forecasts
In part one of this series, we discussed how to find weather data that works well with business intelligence analysis and tools. In part two we used historical weather data to find patterns in our business data warehouse. We first joined the weather data with business records to find the matching weather conditions for the exact time and place of every business transaction. We then used simple graphs and dashboards, as well as automated correlation matrices and metrics to find which specific weather variables correlated most strongly with the business metrics.
Making business decisions using weather forecasts
Now, armed with the insights that we found in part two, we are ready to apply those insights using weather forecasts. As we did when analyzing our historical business records using weather history, we will use the high-quality weather data service that we identified in part one of this article series. Then, we will join this data with our business locations. Only this time, instead of finding existing patterns we will apply the patterns discovered to make more intelligent decisions.
Joining business location and weather forecasts
This process is virtually the same as the joining we discussed in the previous article. The only real difference is that we are joining only on a single value, location, instead of both location and date/time as we did with the historical weather data. So we’ll skip the technical explanation of affecting the join itself. Instead we’ll discuss how to identify the locations to use for the join.
The locations will depend in part what location data is stored in your business warehouse and what patterns were found in the historical analysis. Many businesses have multiple types of physical locations that are interesting for analysis. If you have store locations, for example, you’ll be able to apply weather data to forecast the sales, footfall and other business metrics at each location.
Also consider your customers’ locations. In some cases the business data contains exact addresses for customers. These are easy to use as the basis for weather data joining. However, you may only have the general area of your customer based on ZIP Codes or just city names. These too can be used to look up weather data. Visual Crossing Weather can geocode ZIP Codes and city names exactly as it does complete addresses.
Sometimes site locations are specified precisely in business data using latitude and longitude values. This is more likely the case if your business involves identifying the exact locations of objects in the field such as ships at sea, wind mill locations on a wind farm, etc. Latitude and longitude values also can be utilized to find specific weather data for that exact location.
Also, don’t forget the analysis of human resources within your business. For example, inclement weather may make it harder for employees to come to work. If you are analyzing a business where minimum numbers of on-site employees are required (retail, hospitality, etc.), the weather forecasts of employee addresses can help you plan your scheduling. Also, other interesting patterns may emerge. For example, nice weather may cause some employees to decide to “play hooky” to enjoy the day outdoors. Knowing this and accounting for it in the staffing plan can improve the local store and drive business success.
Matching patterns and insights with forecasts
We now need to match the patterns that we discovered in part two of this series to the weather forecasts for our locations. The best process for this depends on the number of locations we need to evaluate as well as the standard workflow within the business intelligence solution itself.
If we have a small number of locations, it may be useful to consider them all at one time and manually evaluate the upcoming weather conditions by using simple sorts. For example, in Excel it is easy to sort a list of locations on conditions such as temperature and precipitation for the upcoming weekend. As a cliché example, we probably need to order more ice cream for locations that are going to experience hot weather. However, if we are making decisions for the grocery chain discussed in the previous article, we may need to make sure that plenty of bacon is in stock when the temperatures are trending chilly.
However, if we are analyzing a larger number of locations, then a simple sort will not suffice. Many businesses need to consider hundreds or stores, thousands of employees, and tens-of-thousands of customers. In this case, we can use thresholding and alerting that are common features of most business intelligence tools.
In Excel conditional formatting and is easy to setup. You can do so by following Microsoft’s tutorial here: https://support.microsoft.com/en-us/office/highlight-patterns-and-trends-with-conditional-formatting-eea152f5-2a7d-4c1a-a2da-c5f893adb621. This conditional formatting allows you to paint the colors of cells based on specific weather conditions that match the business patterns that were identified earlier. Each color can indicate a certain business action to be taken. And these thresholds can be applied across multiple weather criteria also. So the business can take one action if it is cold and windy and a different action if it is warm and windy.
Every business intelligence tool has a version of this thresholding functionality and some are very powerful. Some can work across multiple visualizations including graphs and other visualizations while others can add reference lines and other visual callouts. Below is an example of thresholding in SAP Analytics Cloud.
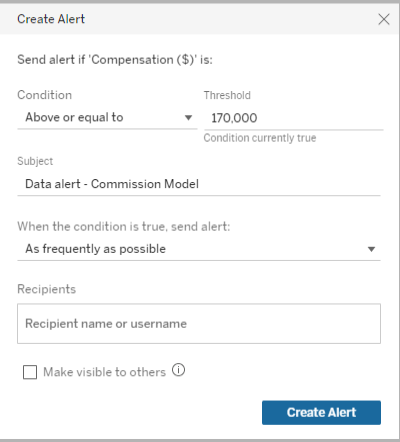
More sophisticated business intelligence tools have even more advanced thresholding and alerting capability. Many platforms can send proactive alerts to email and text message based on data triggers. Consider a restaurant chain that wants to alert its local store managers to upcoming weather conditions likely to affect employee attendance. BI alerts could be triggered each morning showing key weather patterns over the next week or longer. Functionality varies by BI tool, so check your documentation and administrator to learn more. Below is an example of how to set up alerts in Tableau.
Using ultra-long-range forecasts for long-term decision-making
Most weather providers offer a standard 5-day, 7-day, or even an extended 15-day forecast. However, business decisions often need to be made beyond that short-term timeframe. This is where ultra-long-range forecasts, also known as statistical forecasts become valuable. These ultra-long-range forecasts use climate statistics and historical records to estimate the average weather conditions for any day of the year and any location. They can also provide the weather extremes to ensure that every likely weather possibility is taken into consideration when making a decision.
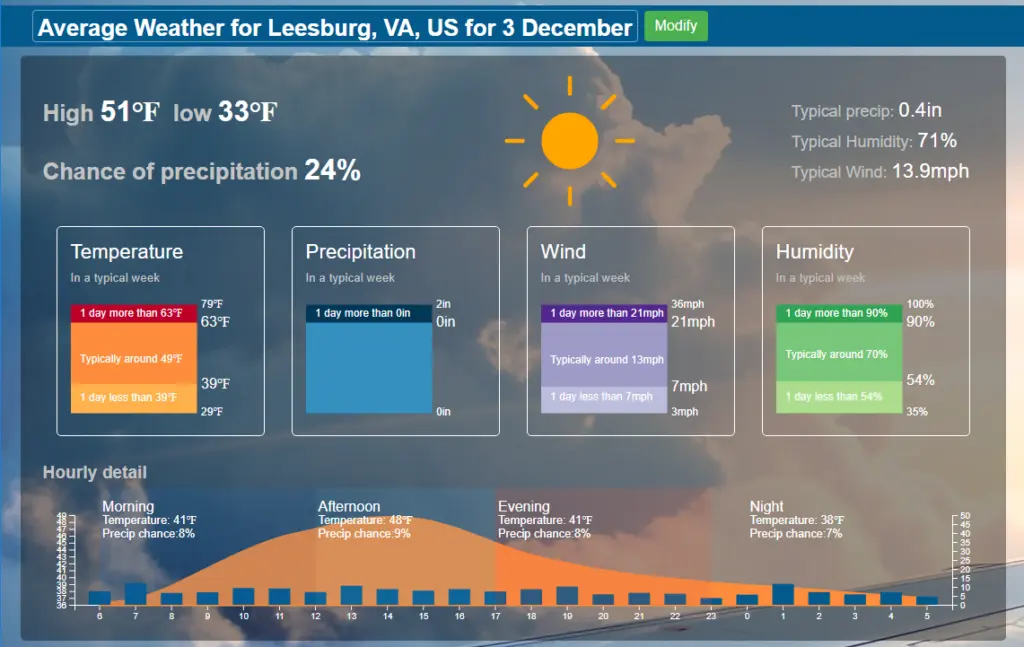
Visual Crossing Weather provides this functionality in multiple ways. You can get it via the web-based query page and the weather API, but if you just want to test it for yourself, you can use the free Average Weather dashboard. Simply enter any worldwide location and date, and you will instantly see what conditions to expect and the extremes for which you may need to plan. It may help save your next vacation.
In the world of BI analysis, however, this data can be very valuable for long-term planning. If your business in planning the location of physical assets, it can be very important to know not only the average conditions at that location but also the extremes. Planning for the extremes can help ensure that your asset will remain productive for years to come. You can also make intelligent decisions about how and where to grow a business based on the weather conditions at existing, successful locations. If your business is weather-sensitive and performs well during certain months at a certain location, finding additional locations with a similar climate during the same times can be valuable.
Summary
In this article series we discussed how to find high-quality weather data that is compatible with business intelligence use cases, how to put the history component of that weather data to use in analyzing an existing business data warehouse, and how to use the lessons learned to apply to future business decisions. Most of these tasks are made much easier when you answer the first question correctly, however. That question is, “What is the best weather data provider for use in my BI project?” The power and flexibility of that provider often determine the business value that is achieved. Upon careful evaluation, we think that you will come to the same conclusion that many successful BI decision makers have. That conclusion is that Visual Crossing Weather is the ideal partner for your BI weather data needs.
If you have any additional questions or need more information, please reach out to us. Our weather data experts love helping people get value from weather data, and our decades of experience in business intelligence ensure that we can not only speak the language of business intelligence but also make your project successful.