

Historical cloud cover and visibility data are useful weather measures that are needed in various transportation, business, and recreational activities. Whether you are looking for cloud data to analyze solar panel performance, manage air travel, or determine the best places and nights for stargazing, a weather data service such as Visual Crossing Weather can provide cloud cover and visibility data easily using global historical reports going back to 1970.
What cloud and visibility measures are available?
The two key measures, Visibility and Cloud Cover, are related in their ability to measure the visibility of the sky and the surrounding views on Earth. The visibility measure describes the horizontal opacity of the atmosphere. That is, if you are looking out at other points on the Earth, the visibility measure tells you how far away objects can be and still be identifiable.
Cloud cover tells a similar story in the vertical dimension. It tells us how much of the sky is blocked by clouds at a given time from a given location. The more clouds, the less able we are to see stars, planets and other objects in the sky including the sun for solar power. Note that the cloud cover measure does not take into account pollution or other conditions that may limit vertical visibility. So, if appropriate, you should consider other visibility characteristics of your location in combination with raw cloud cover data.
What are the units and range for historical cloud and visibility data?
Visibility is reported in the long-distance unit of the units system chosen for your query. That means that in the standard system, the unit is miles and in the metric system, the unit is kilometers. Visibility is more ambiguously defined than most other weather measures. In general, during the daytime you should be able to “see and identify” a “prominent dark object” on the horizon at the given visibility distance. At night, you should be able to do the same for a “moderately intense light source.” However, the exact definition of these terms remain somewhat ambiguous and vary across different station implementations. So the exact number given for visibility should be considered more of a guideline than an absolute.
As for visibility range, there are many situations where the visibility range can be near zero. This is often due to dense fog, air pollution, or a combination of the two. The place on Earth purported to have longest visibility is between Massif des Ecrins and Pic de Finestrelles in the Pyrenees Mountains on the border between France and Spain. The visibility distance there has been recorded at over 270 miles (437 km)
Cloud cover is reported as a percentage representing the fraction of the sky that is obscured by clouds. As one would expect, the range for this measure is between 0% (completely clear skies) and 100% (clouds completely obscuring the sky). While there are no known records for the minimum and maximum in cloud coverage, it is interesting to note that satellite analysis has shown that Europe, North America, South America and Asia have more cloudy skies while Africa, the Middle East and Australia have more clear skies. It is also interesting that while cloud cover varies significantly day-to-day, the year-over-year averages for a location tend to vary rather little.
How can I find cloud and visibility data for a specific location and date (or date range)?
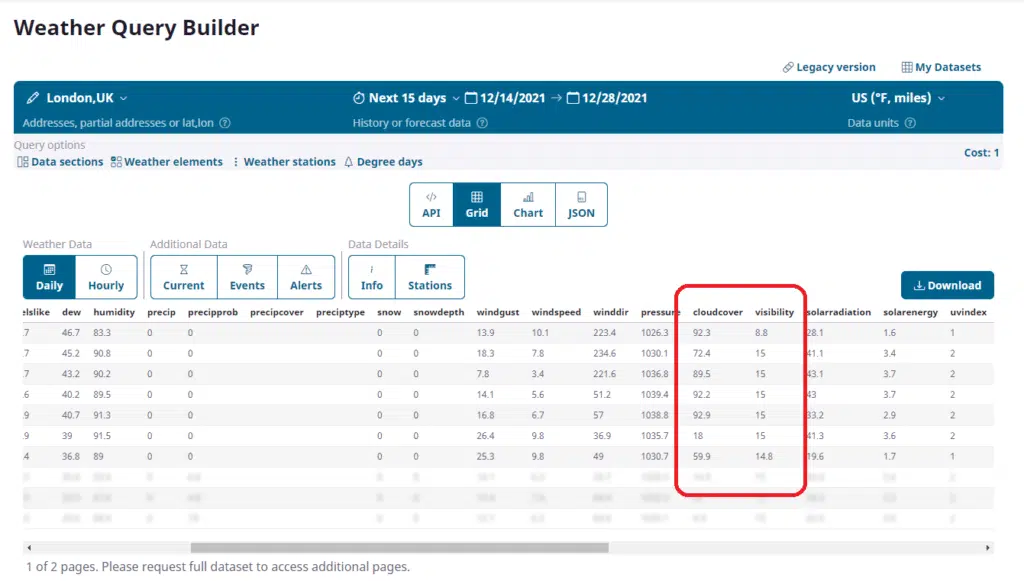
Visual Crossing Weather offers multiple ways to find the visibility and cloud cover data for a specific location and date. One easy option is to use the Visual Crossing Weather query page to get the weather details. This is a great option if you would like to download the cloud data as a CSV file or as an XSLX for loading directly into Excel. First, sign up for a free account on the weather query page if you don’t already have one. You can then enter your location, select the date range, and submit your historical weather query. After the query is run you can view the results directly on the webpage or download the results for further analysis.
Another option is to run a query via the Visual Crossing Weather API. Using an API allows you to run your query from inside any script or code automatically. The Visual Crossing Weather API uses a simple query URL to define a weather query. You can run this URL in a command-line tool such cURL, in your own script or code, or even directly in a web browser. The query returns the weather results including cloud cover and visibility in CSV or JSON format. CSV results are easily loaded into a database or data science tool while JSON is a format that is easily parsed in languages such as Python and Java. If you follow our how-to guide, you can learn how to run your first weather API query in just a few minutes.
Summary
Cloud and visibility data are historical weather measures that are important for many purposes including solar energy, transportation, and various hobbies. Using Visual Crossing Weather, it is easy to find historical cloud data for any worldwide location in multiple convenient ways including the weather query page and the fully embeddable weather API for your code. Visual Crossing weather makes finding cloud and visibility data simple.
If you would like to learn more about cloud and visibility data in Visual Crossing Weather, you can read more in our data documentation.
Questions or need help?
If you have a question or need help, please post on our actively monitored forum for the fastest replies. You can also contact our Support Team.