

This article shows the necessary steps to quickly and easily load weather forecast data for any location of the world into TIBCO Spotfire via ODATA request. The tutorial shows step-by-step how to construct the query in the Visual Crossing Weather web interface, how to access the automatically generated connection string and then create a data connection for the weather forecast results to analyze it in connection with your business data in your TIBCO Spotfire Analytics Application.
If you are interested in how to import historical weather data into TIBCO Spotfire , be sure to check out our article How to load historical Data into TIBCO Spotfire.
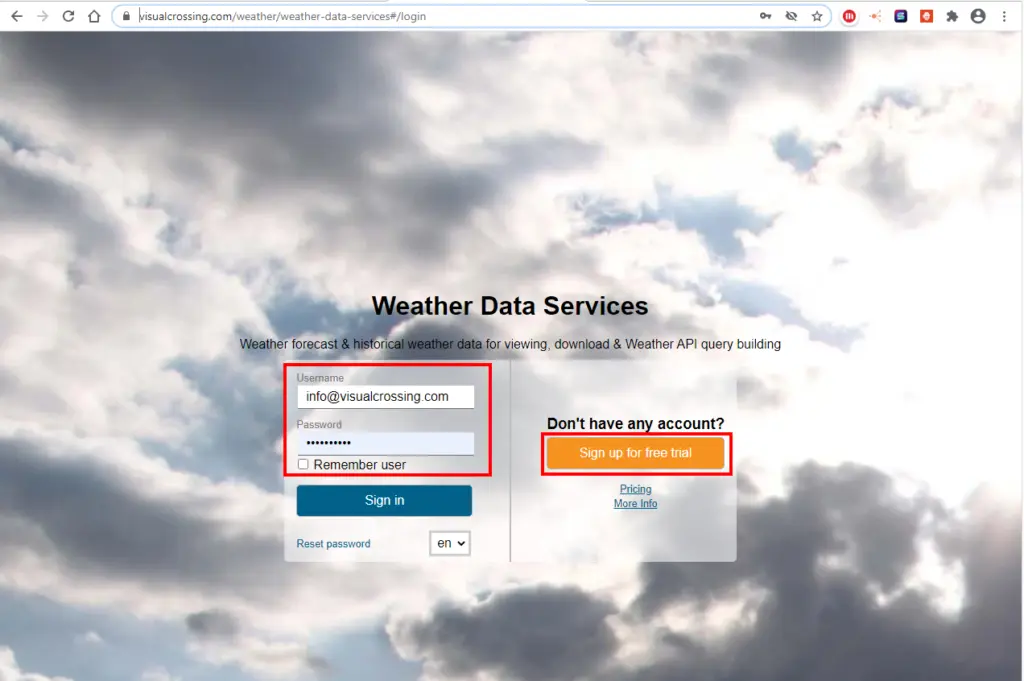
Step 1 – open Visual Crossing Weather Data Services
Open the Visual Crossing Weather Data Services log-in page and sign into your Visual Crossing Weather account. If you don’t already have an account, you can sign up for a free trial on the same page. Signing up for a free trial account will give you immediate access to a full 15-day weather forecast for any location.
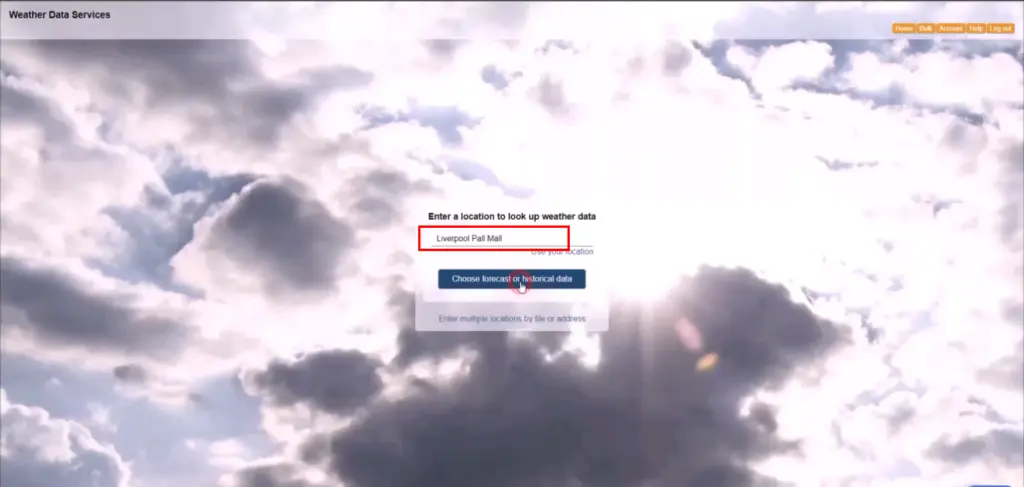
Step 2 – specify your locations
The first page will prompt you to add the locations to retrieve the weather forecast for. There are two options in the web interface to manually add locations. As direct entry of either the physical address in clear text or as bulk entry in form of a file upload. In this scenario we go with the manual option. Simply enter the details of your location the text box and hit the ‘Choose forecast or historical data’ button afterwards. For more details please see the Visual Crossing Weather Data Tutorial section
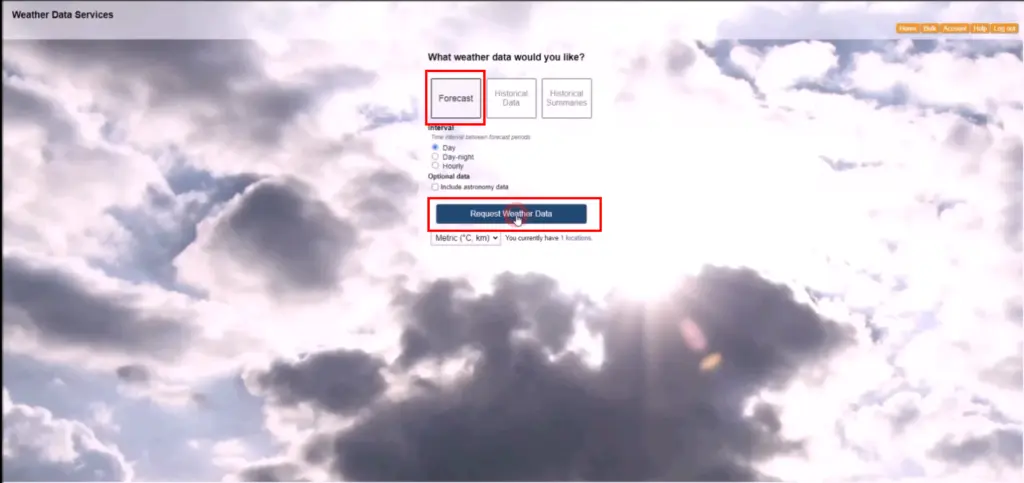
Step 3 – Request Weather Forecast Data
On the next page you can select the type of data you want to download.
The options are forecast, weather history queries, historical data summary reports. The data can be broken down bay day, day-night sections or hours. moreover you can specify the unit groups you would like to see in your result set. This tutorial will continue with the daily forecast option. Please reach out to us if you need more information on the other options or browse our tutorial and video section for more details.
Select the forecast option and click the ‘Request Weather Data’ button.
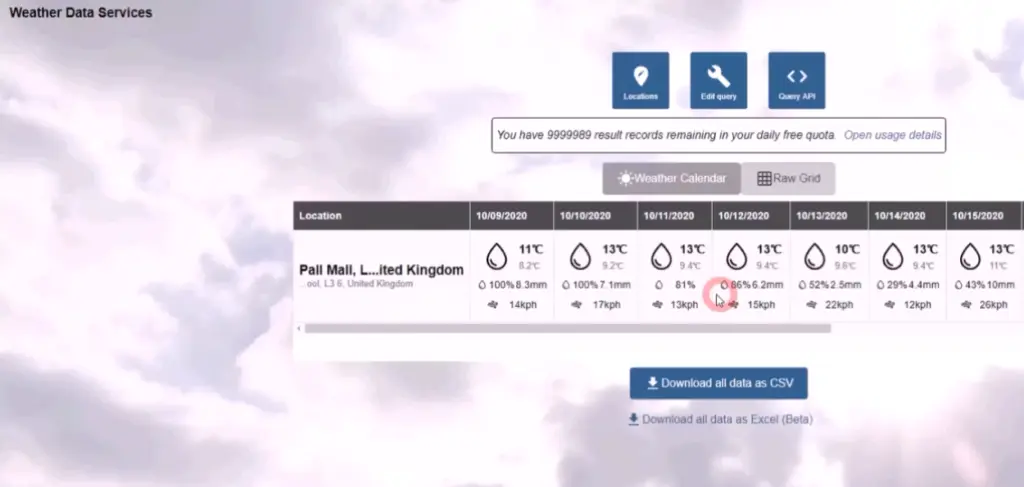
Step 4 – review the weather forecast data
The default view for the query results is the weather calendar. This view provides a simple overview of the result data.
Step 5 – Generate the Query string
To automatically generate a query string for your locations click the ‘Query API’ button

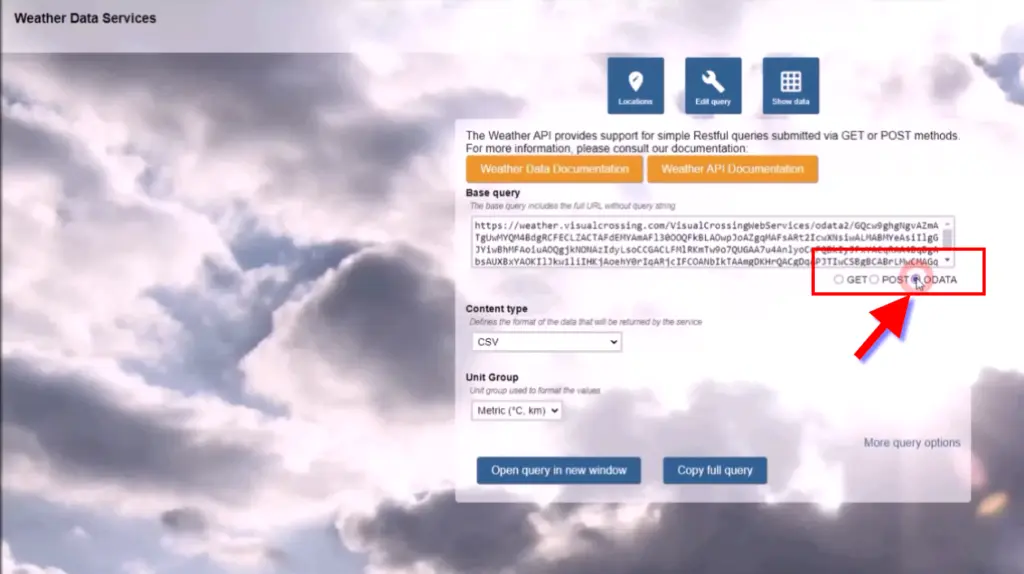
Step 6 – Select query options and copy the string
The query can retrieve data using GET, POST or ODATA. For the TIBCO Spotfire use case please select ODATA.
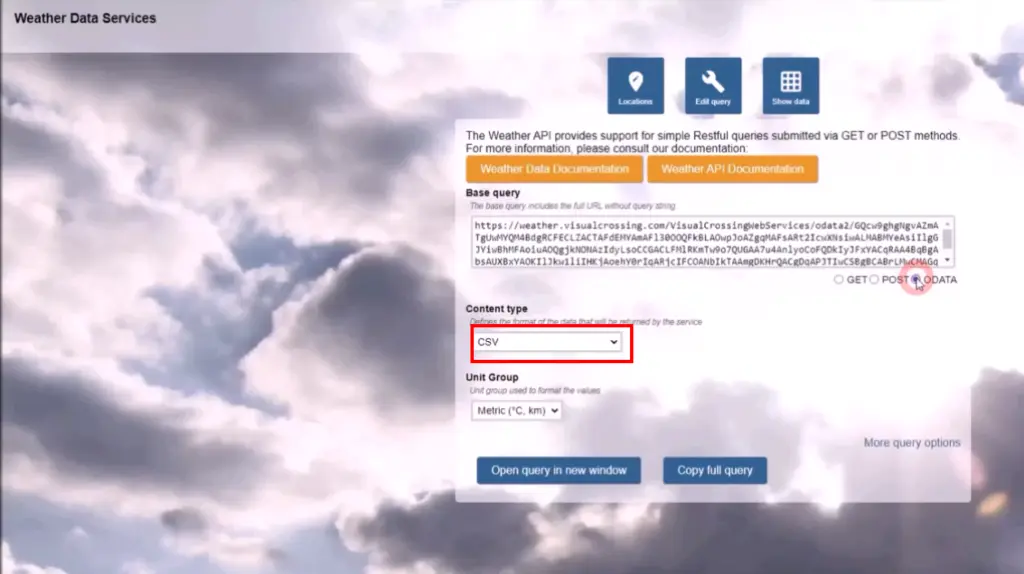
The ‘Content Type’ section allows to chose between CSV and JSON data format. For TIBCO Spotfire select the CSV format.
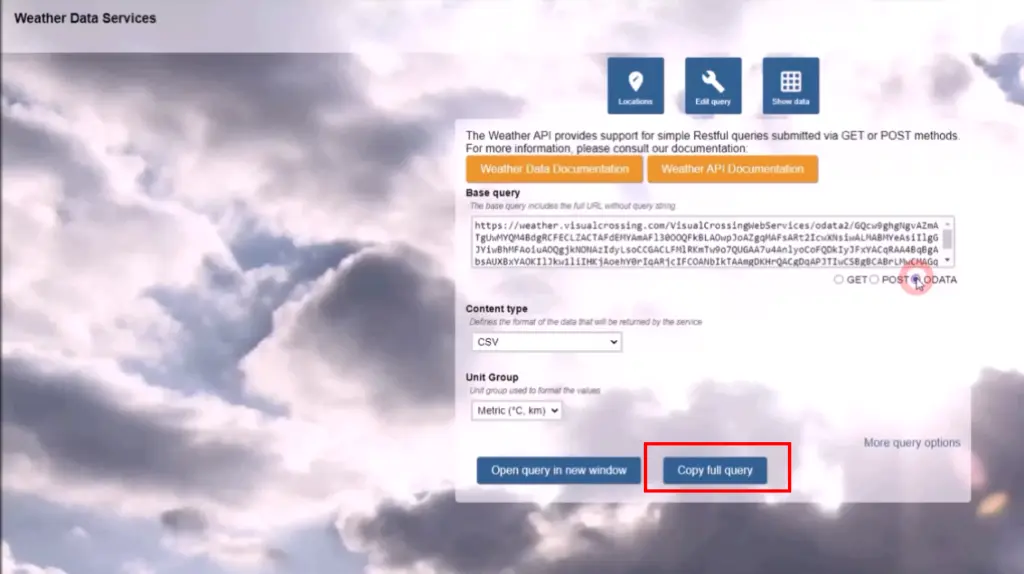
Besides the unit group drop down (US, Metric, UK) you have additional option in the ‘More query options’ section. For the details please see our ‘Getting Started Guide’. To copy the query string to the clipboard click the ‘Copy full query’ button.
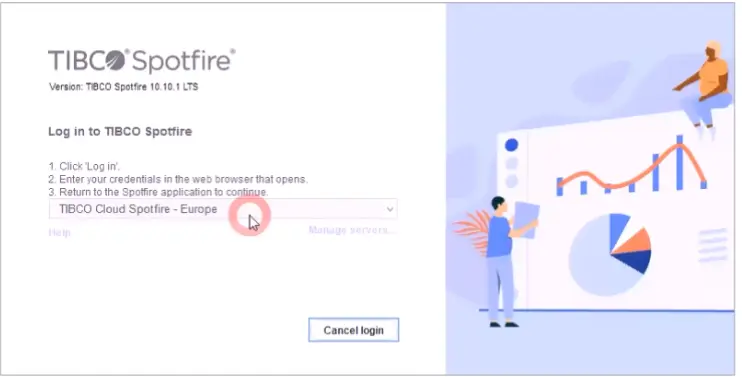
Step 7 – Log in to your TIBCO Spotfire and add a connection
Login to TIBCO Spotfire account
Select the ‘Connect to’ option on the data exploration splash screen
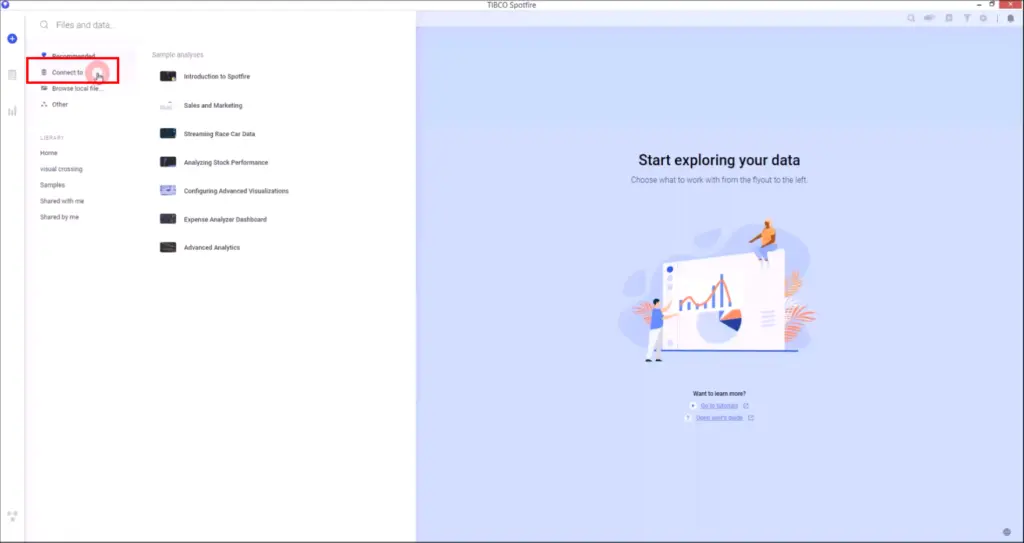
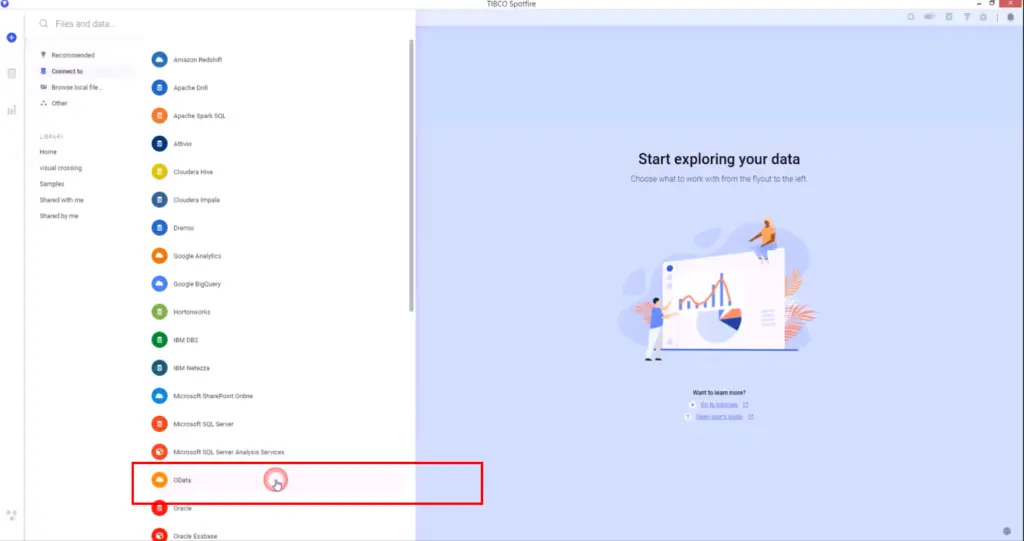
Select the OData entry from the appearing list.
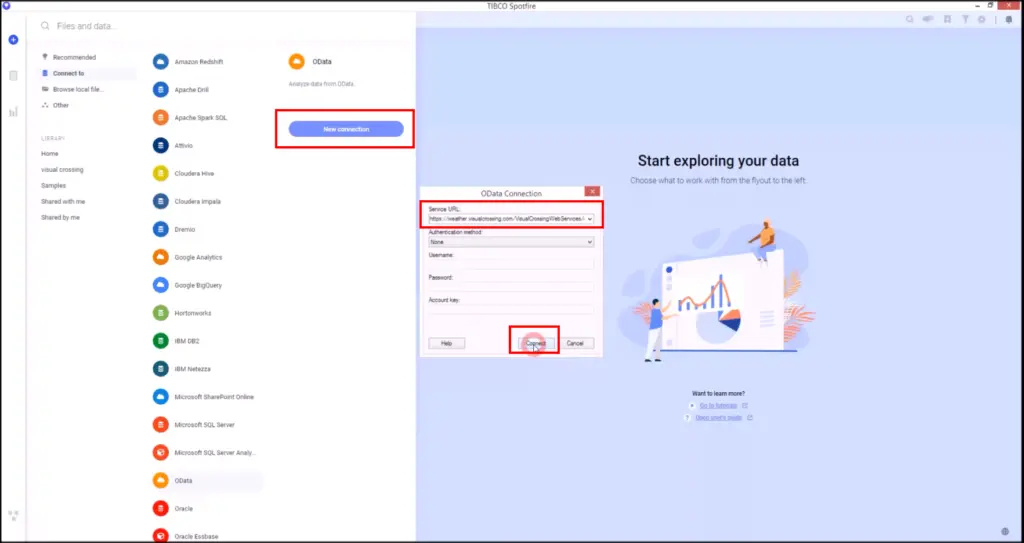
Step 8 – Configure your OData connection
Click the ‘New Connection Button’ and copy the ‘Service URL’ you created in Step 6 of this tutorial into the corresponding form field. You don’t need to enter any of the other fields since the authentication is encrypted in your connection string.
NOTE:
you need to add the following text at the end of your copied string: /WxRequest
Finally hit the ‘Connect’ button.
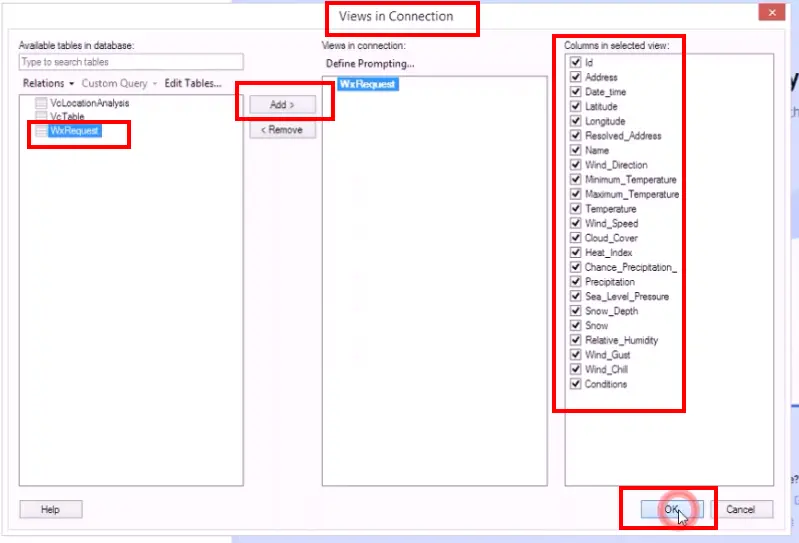
Step 9 – Select view and columns needed for you analysis
The ‘Views in Connection’ editor allows to select from multiple data tables available form the data source. In our case the view containing the actual data is called ‘WxRequest’ and this needs to be added by clicking the ‘Add’ button. On the right hand window you will see the columns of the selected table to check or uncheck those relevant or not needed for your analysis.
Once the selection is made hit the ‘OK’ button.
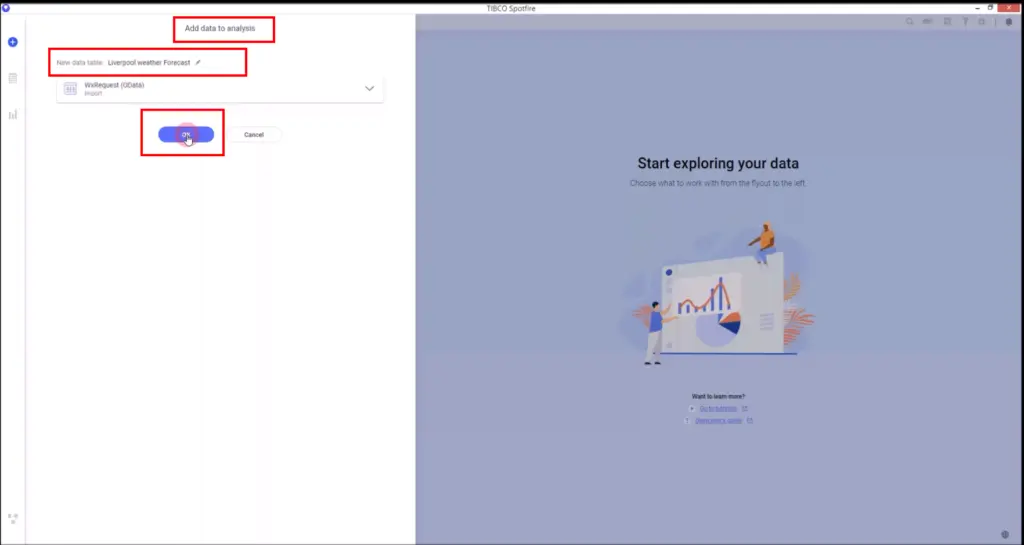
Step 10 – Add the selection to the analysis
Give your new dataset a name and hit the ‘OK’ button.
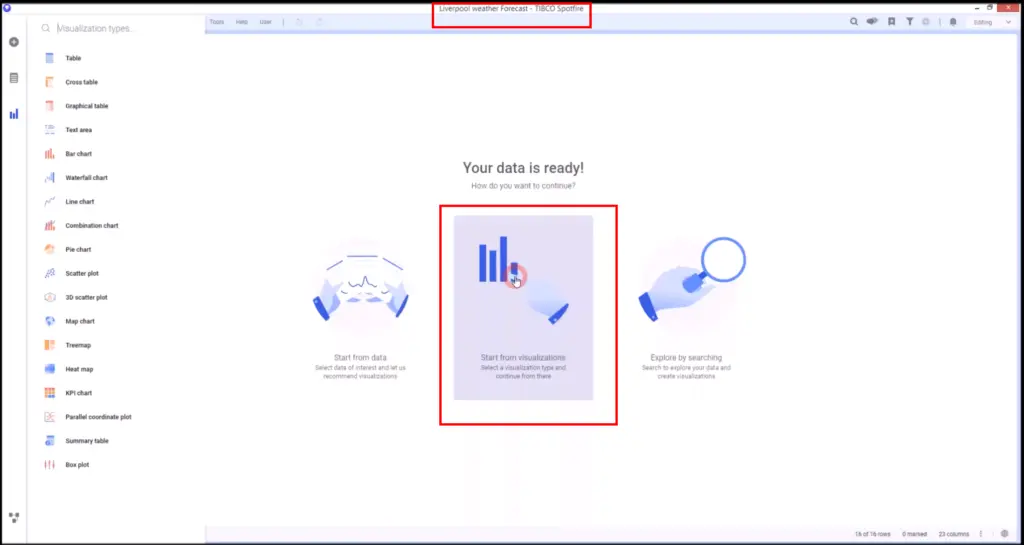
Step 11 – Start analyzing and visualizing
Your weather dataset is now ready to be used in the TIBCO Spotfire analytics flow.
Select for example the ‘Start from visualizations’ area…
…and start building your graphs
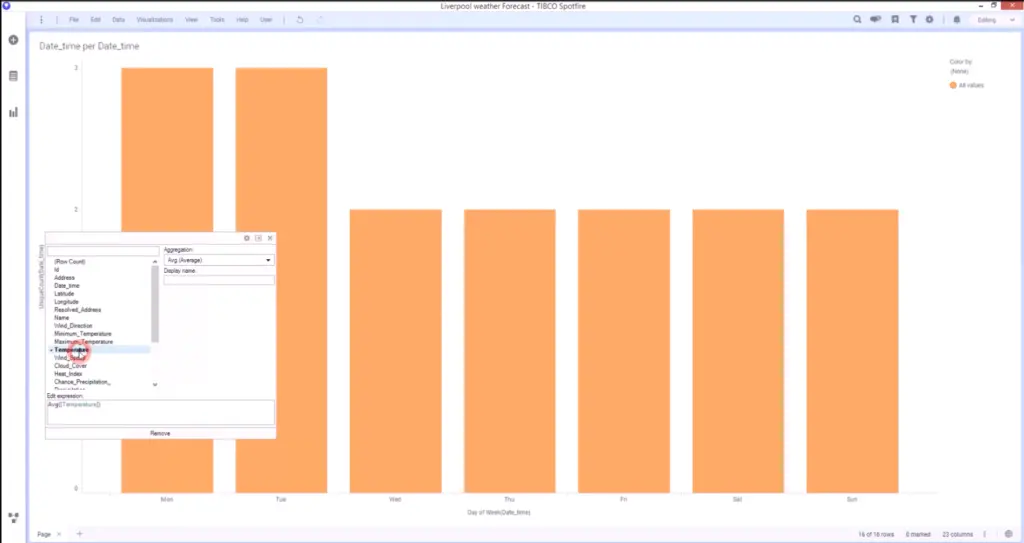
As you can see, importing weather data into TIBCO Spotfire is simple and straightforward.
Questions or need help?
If you have a question or need help, please post on our actively monitored forum for the fastest replies. You can also contact our Support Team.