

This articles shows how to download weather forecast data as a standard Excel file format that can be opened in Apache OpenOffice Calc.
If you would prefer, you can also download weather data in CSV format. See how to download weather forecast data or weather history data as CSV format.
Step 1 – Open the Visual Crossing Weather Data Page
To start download the weather forecast data, navigate to the Visual Crossing Weather Data page. Then we need to click on the link to go to weather data download page near the top of the page.
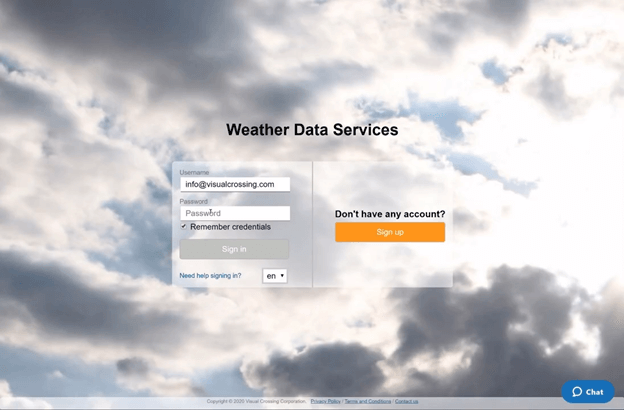
Step 2 – create a free weather data account and sign in
On the log-in page sign into your Visual Crossing Weather account. If you don’t already have an account, you can click on the orange button on the right side of the login prompt. Signing up for a free account will give you immediate access to a full 15-day weather forecast for any location.
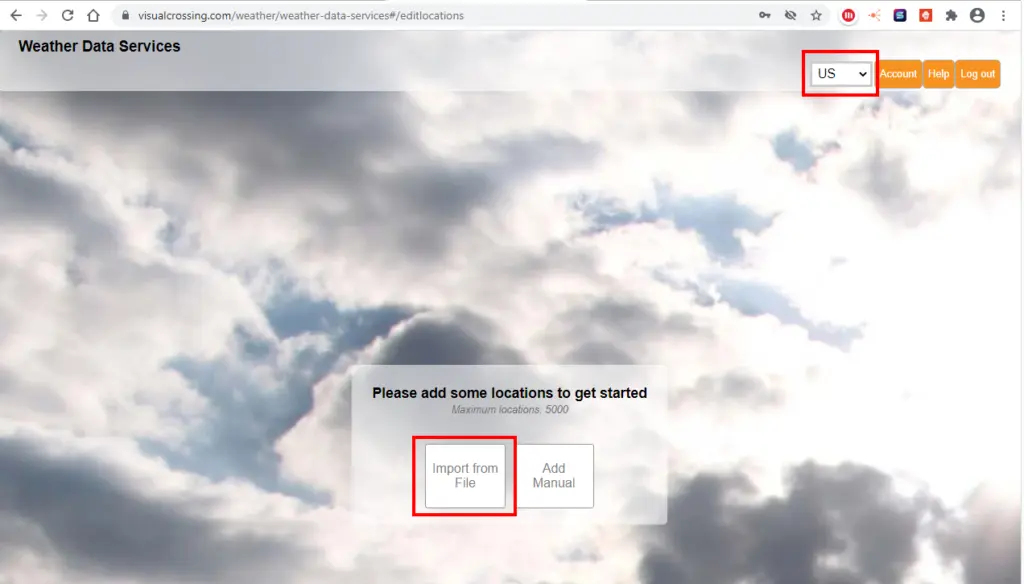
Step 3 – Upload locations to get the weather data for
The first page will prompt you to add the locations to retrieve the weather forecast for. There are two options in the web interface to manually add locations. As direct entry of either the physical address in clear text or as bulk entry in form of a file upload. The following steps refer to the file upload option – for more details please see the Visual Crossing Weather Data Tutorial section
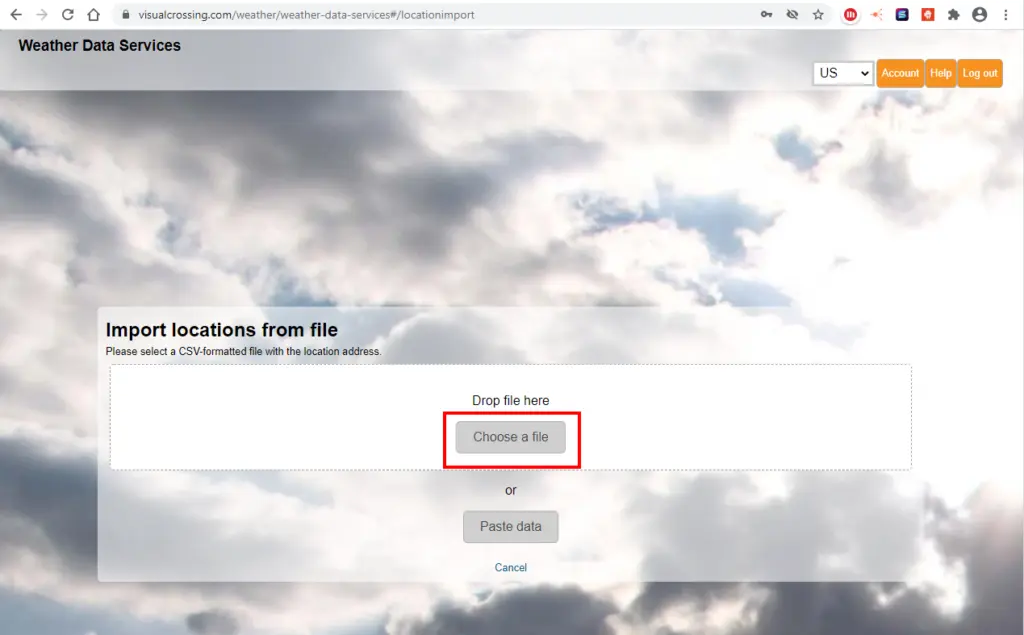
The next screen will prompt you to select the file containing your locations of interest. You can browse to the file on your hard disk. simply drag an drop it to the corresponding section or paste the content directly into the web page.
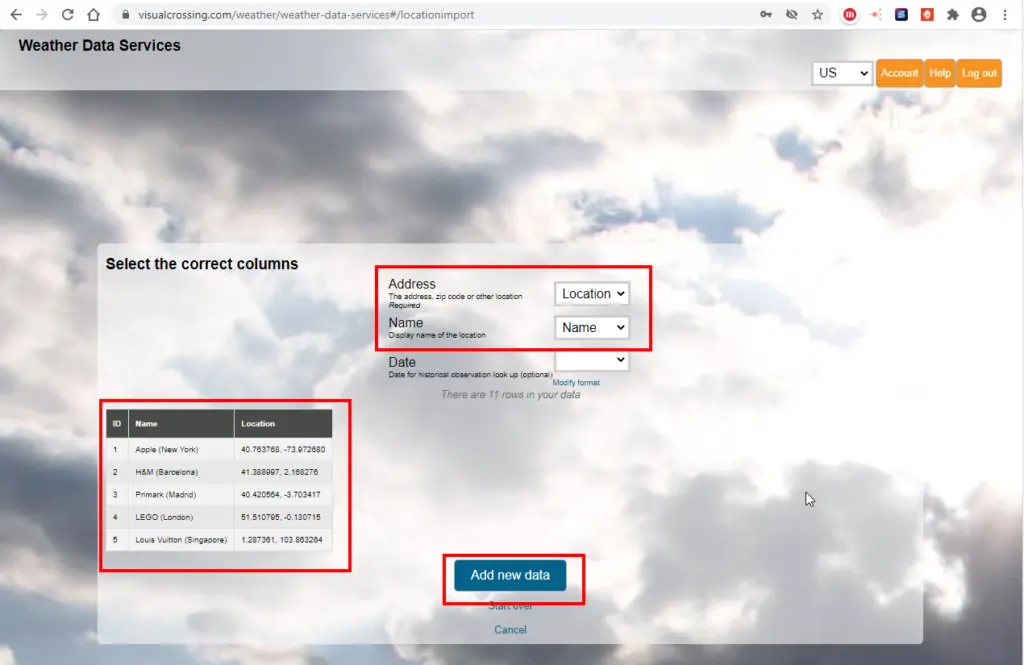
You now need to configure the location information. In the ‘Select the correct columns’ form, select the the address and the name column of your data set. For the forecast you can ignore the date column which refers to the retrieval of historical data. The address can be a Latitude / Longitude pair as well as simply address, a city name, or a postal code. For convenience you see a preview of your data set. Once finished press the ‘Add new data’ button at the bottom
Step 4 – choose the weather data query type
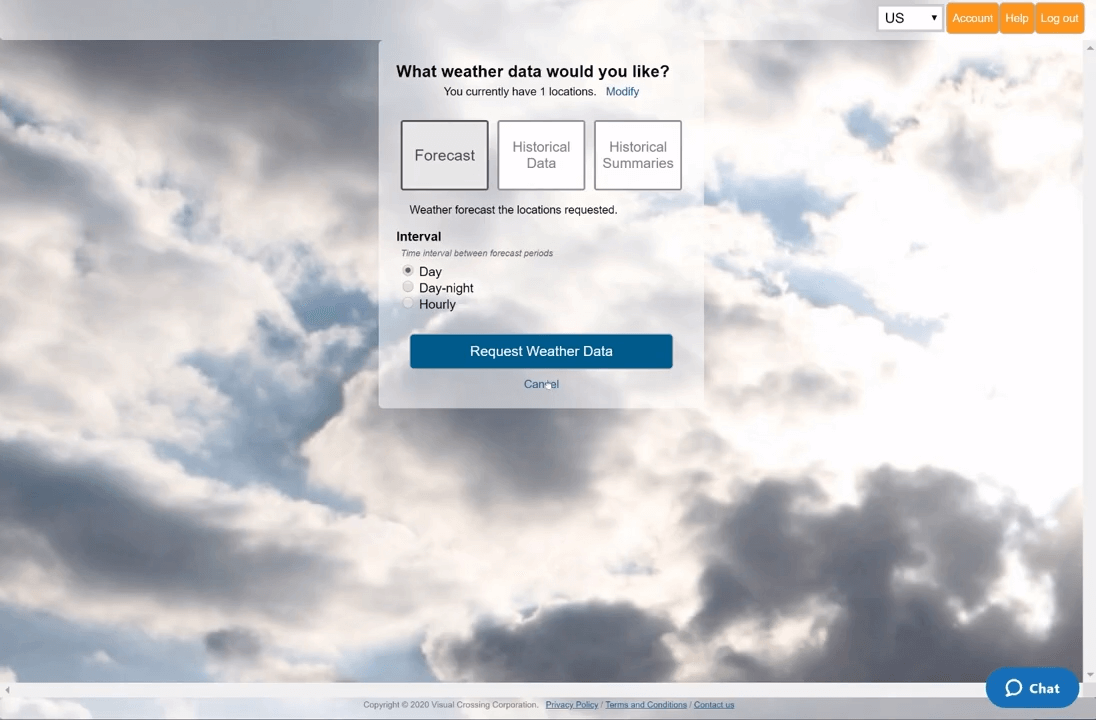
Next, we need to choose the query type. Since the default Forecast option provides a 15-day daily weather forecast, we can just accept the default for the purpose of this tutorial. However, in this panel there are other options as well including weather history queries, historical data summary reports, and hourly data.
These are among the many options covered by our other tutorials and videos. Please take a look at those or reach out to us if you need more information on these options.
Step 5 – request the weather forecast data
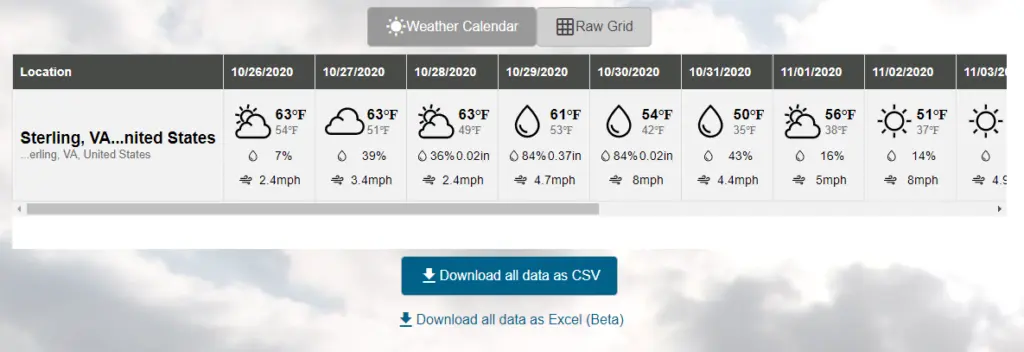
When we run the query the default view is the weather calendar. This view provides a simple overview of the result data. You will notice that if we entered a friendly name for the location, it will be shown here. The calendar view is most useful for comparing data from different locations side-by-side.
Step 6 – View the full weather forecast data view
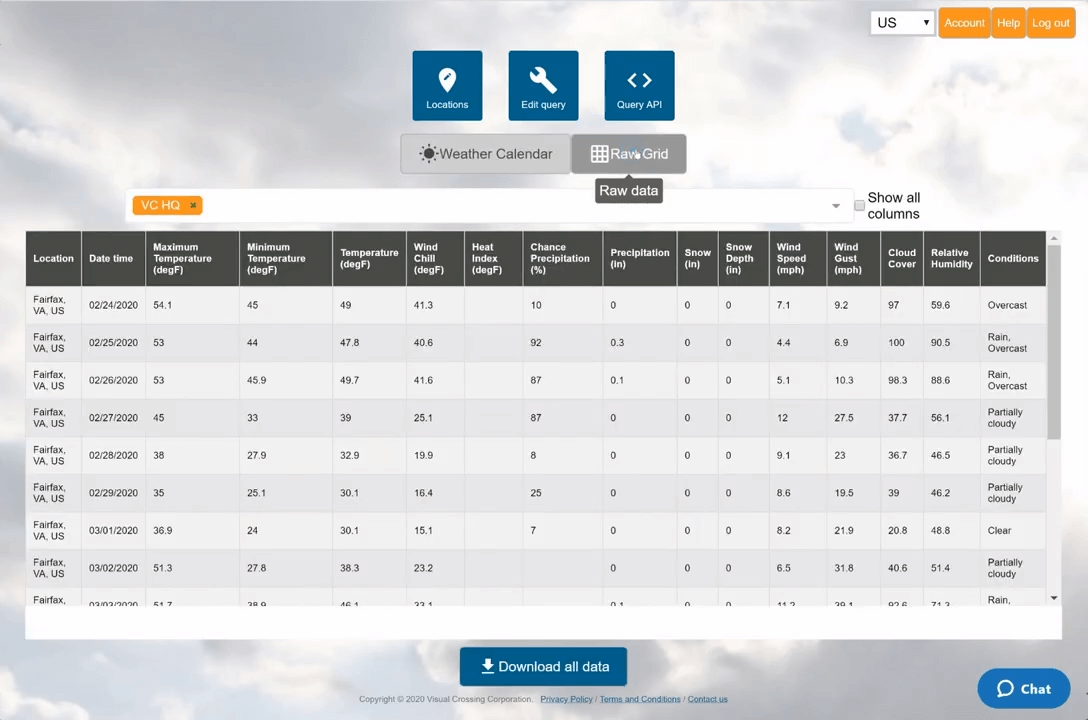
To see more details we can change to the grid view by clicking the “Raw Grid” button near the top of the page. This view gives a single row for each record in the forecast data. In this example, we will have one row of forecast data for each day of the 15-day forecast at the location we selected earlier.
You can see the various weather metrics that are provided in the output data. These metrics include common values such as temperature, precipitation, and wind as well as less common value such as heat index, cloud cover, and wind gusts. For more information on the details and how to use all of our weather metrics, please see our weather data documentation.
To add a second location, we need to click on the Locations button at the top of the window and then follow the steps that we used earlier to add an additional location manually. That is, after clicking on the Locations button, we click on the Add Manual button and then enter a second location.
Step 7 – Download the weather data as a .XLSX file
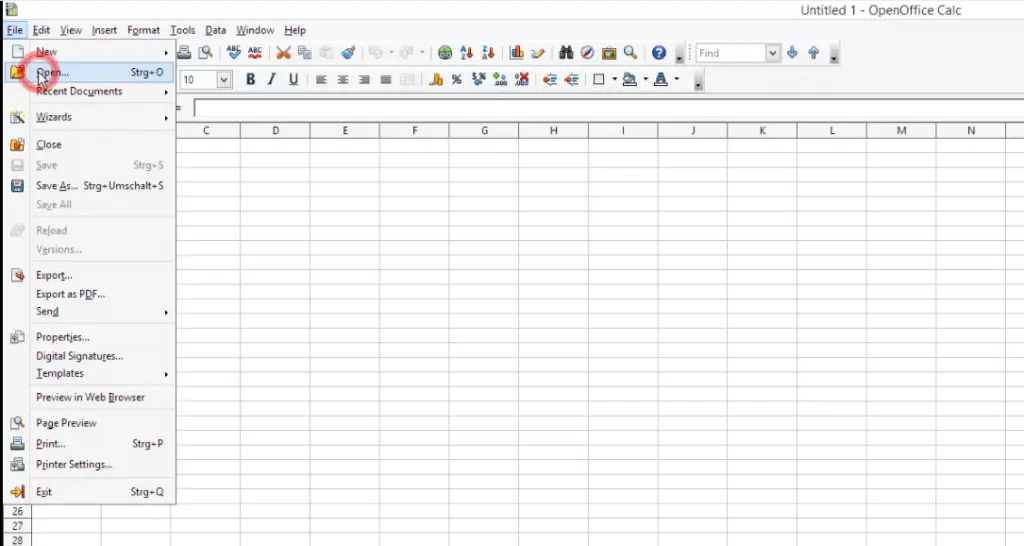
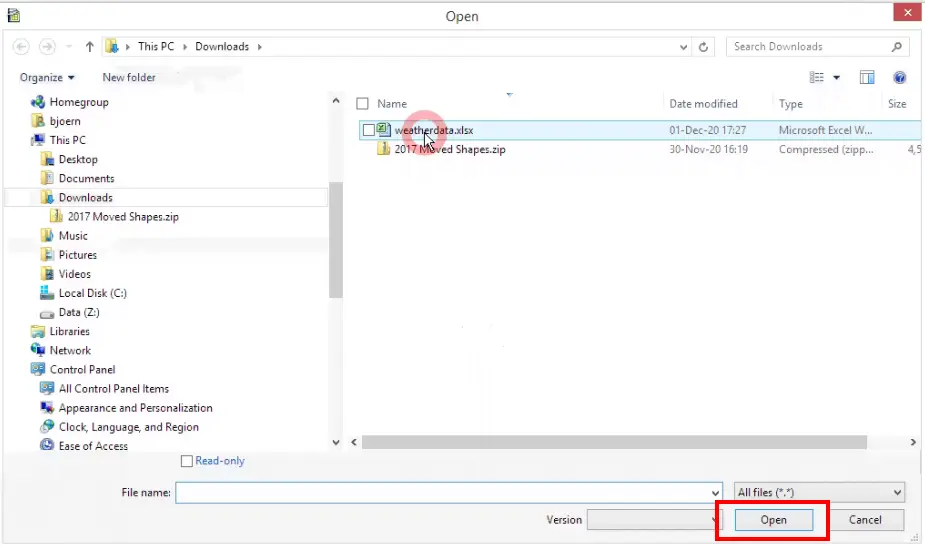
Step 8 – Run your OpenOffice Calc Application and open the file
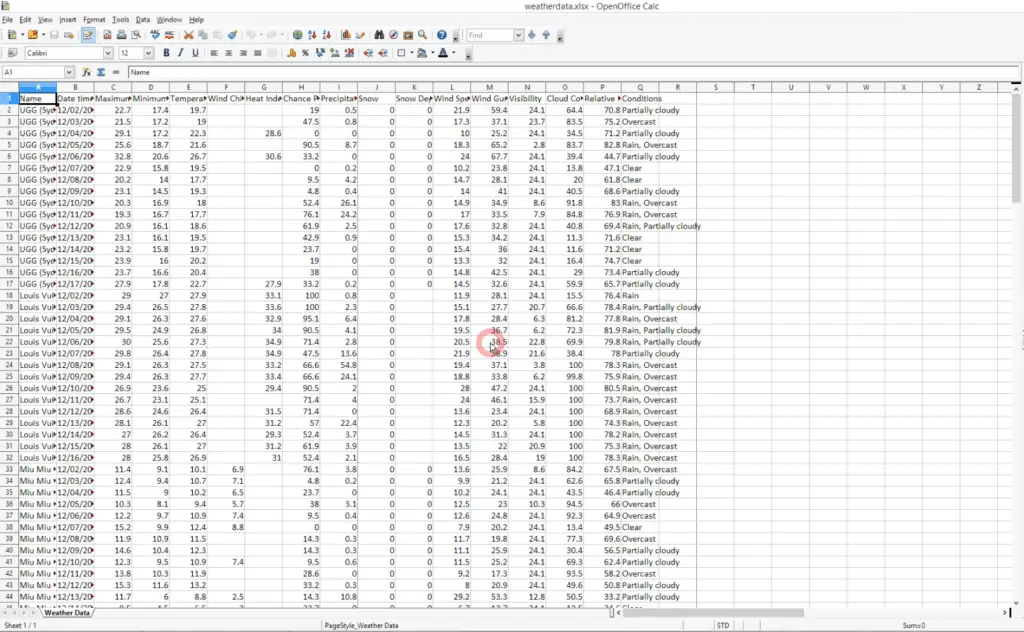
You can now open the just downloaded XLSX file in OpenOffice Calc by selecting the file in the ‘Open’ dialogue.
You can now use the full OpenOffice functionality for viewing, visualizing and manipulating the weather data.
If you would like to learn more about using Visual Crossing Weather options such as history data, multiple location import, and use within other analysis tools please see our other tutorials.
Questions or need help?
If you have a question or need help, please post on our actively monitored forum for the fastest replies. You can also contact our Support Team.