

Estimated reading time: 7 minutes
Historical rainfall data is easy to obtain from various sources, but the best options differ depending on your needs. Below, we’ll help sort through the options to find the easiest and best way to obtain historical rainfall data for your project.
Single Location and Single Date
If you need historical rainfall data for only a single location and a single date, you can use a weather history page such as Visual Crossing. For example, the following URL will give you weather history data for Herndon, VA.
https://visualcrossing.com/weather-history/Herndon,%20VA/us/last15days/
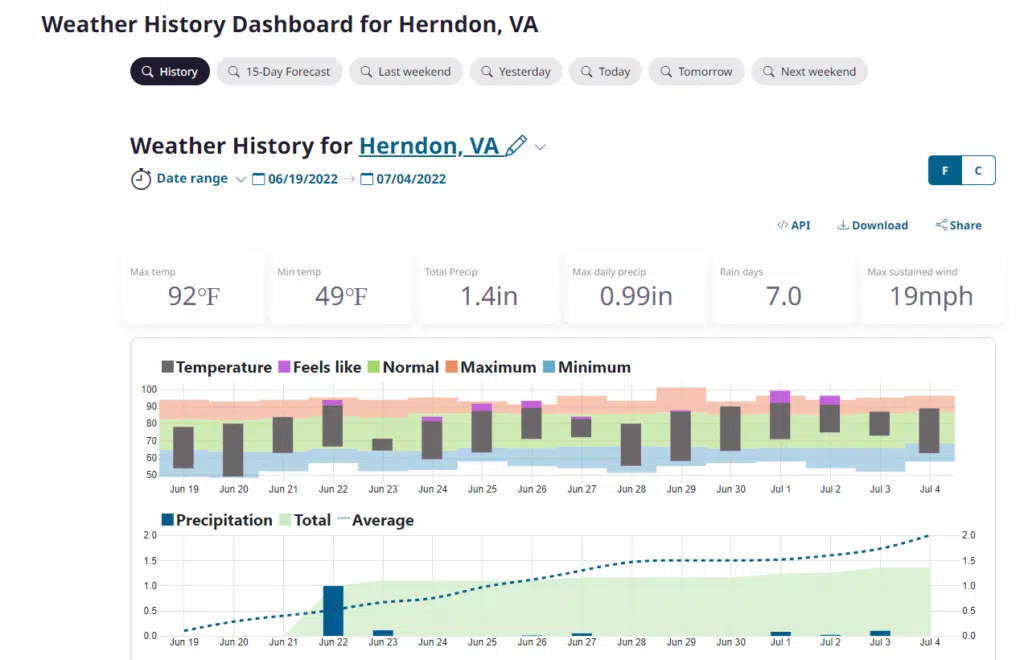
Simply select the specific date(s) in which you are interested, and the metrics on the page will update to show the weather on that date. To find the rainfall on that date, scroll down the page until you see the precipitation section.
There are some great features to note about this method.
First, the data is presented on a web page that shows informative graphs and tables to be very user-friendly. Users can scroll to the weather station map at the bottom of the page to see exactly where their nearest stations are and which ones typically contribute to their historical weather data observations.
Another valuable feature is the ability to see how your current selection compares to a 10-year “typical” weather pattern for this location and time. The color-coded area graphs that serve as a background for your selected weather will tell you how it compares to those averages.
Finally, this dashboard has a few hidden features for more advanced users or those who are looking to take the next step with weather.
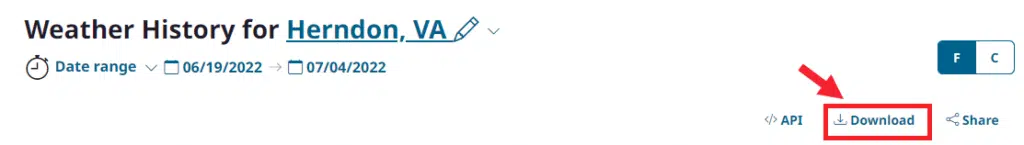
By clicking on the ‘Download’ button, you will be taken to the Query Builder page, where your current query will automatically select the options and show you the raw data that is available for download for users with accounts. (Free accounts are available.)
Even more advanced users can click on the ‘API’ button to see the Web URL query string that can be used to retrieve data in browsers, web, Excel, and other applications that can utilize RESTful web queries.
There are also some negatives related to this method. One primary limitation is the inability to load more than a single location. If you need data for multiple locations or dates, this process will become tedious very quickly.
Multiple Locations
If you need access to a solution that can handle multiple locations, then a more robust option, such as Visual Crossing Query Builder, is likely the best for you. Data is available in CSV, Excel, and JSON formats for easy download, scheduling, or direct API query.
For a full tutorial on the Query Builder, you can utilize the following guide:
To get started quickly, we will use the “Download” link above to get to our query immediately.
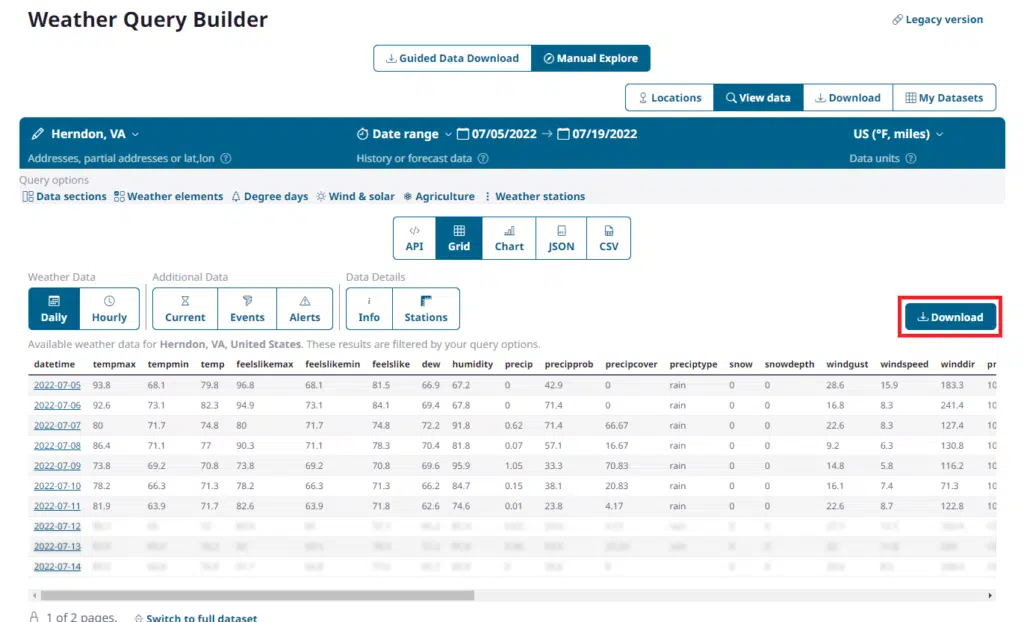
Once in the Query Builder you will see the raw data in a table ready for download or modification:
From this point, you can advance as far as you would like with choosing weather options, hourly/daily, weather metrics, and much more. To query for more locations, simply choose one of the following Location sections:
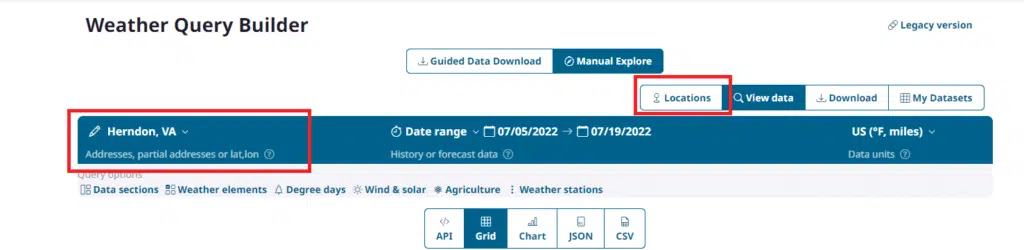
Then add a location such as “Chicago, IL” and click the ‘+’ button:
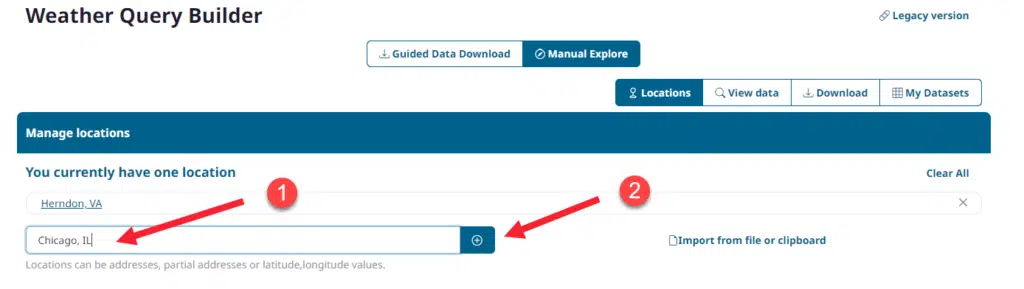
Some of the positives of this approach are that you can easily get data for many locations for large date ranges very quickly. You can even import an entire list of thousands of locations at a time.
Now we can return to the ‘View Data’ section and click ‘Download’. This will give us a good set of options to choose from, including hourly/daily and the format we would like the data.
We recommend CSV for its versatility and readability, even as plain text. It easily imports into any database or spreadsheet tool, such as Excel. It also has the benefit of including all locations in a single file of data.
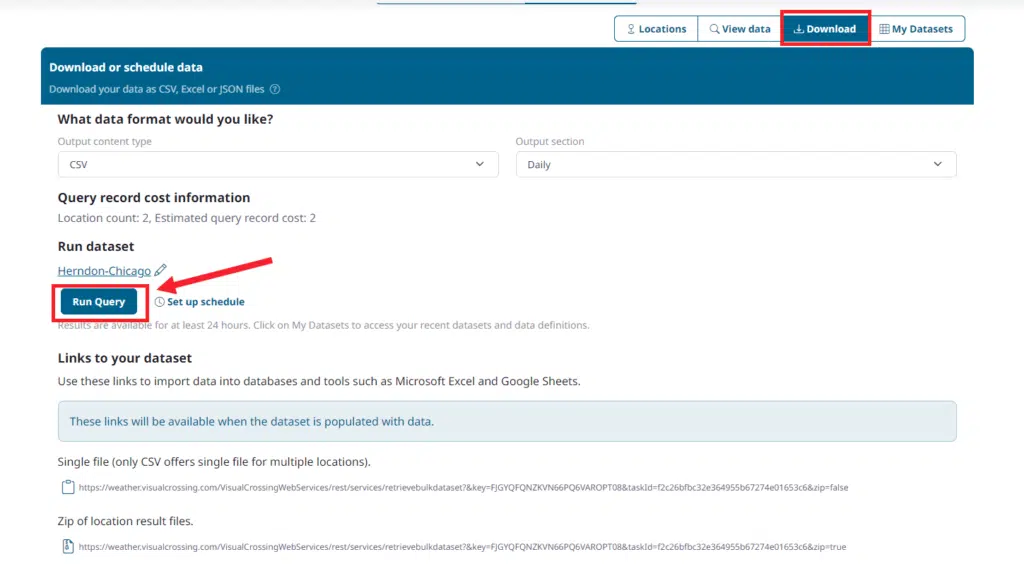
Finally, click “Download” after the query finishes running. The file will appear in your browser’s download section. Be aware that some browser security settings will either not allow or hide the download until you give it permission. A small icon in the upper right will indicate if there was an issue.
Now that you have your CSV file, you can analyze it in a variety of tools.
Approach
Another positive is that the Visual Crossing Weather tool relies on the highest quality government weather reporting stations and will automatically interpolate among multiple stations in order to find the most valid weather details for a given location and time.
This means that you don’t need to worry about selecting a “major” reporting station or manually accounting for situations where a specific station does not report valid data. The tool will automatically handle these cases without your intervention. You can read more about how we process integrated surface database historical weather data.
Summary
You can find historical rainfall and other metrics from various sources. If you need data for only a single location and date, a site such as Visual Crossing History Dashboard can be used to view historical weather data easily.
However, if you need data for multiple dates and locations, a more robust weather data source, such as Visual Crossing Query Builder, can get you the data that you need without the slowness and frustration of the more basic consumer web page options.
In addition, if you need the weather data in an analysis tool such as Excel, Google Sheets, or a database, then Visual Crossing Weather is a far better option.
FAQs: How to Find Historical Rainfall Data for Your Project
Where can I find historical rainfall data for a specific location and date?
You can use the Visual Crossing History Dashboard to easily view precipitation, temperature, and other climate data for a specific location and date. Just enter a location (like a city or ZIP code) and scroll to the precipitation section. It’s ideal for quick access to past weather at a single location.
How can I download historical rainfall data for multiple locations?
The Visual Crossing Query Builder is designed for bulk data access. You can add multiple station names or upload a list of locations, set your date range, and download historical rainfall data in just a few clicks. It’s perfect for multi-site or multi-day dataset needs.
What format is best for analyzing historical weather data in Excel or a database?
We recommend downloading your historical rainfall dataset in CSV format. CSV files are easy to read, compatible with tools like Excel and Google Sheets, and can be imported into any database for advanced data analysis or modeling.
Does Visual Crossing provide rainfall data from government weather stations?
Yes. Visual Crossing sources its historical weather data from high-quality government weather stations, including those used by national centers. The system also interpolates data from nearby stations when necessary, ensuring the most accurate environmental information possible.
Can I access hourly and daily rainfall totals in the same dataset?
Yes. Visual Crossing allows you to select both hourly and daily options using pull-down menus in the Query Builder. You can export both resolutions in one query, giving you flexible access to rainfall totals and snow depth across any time period.
What’s the easiest way to automate rainfall data downloads for multiple dates?
The Query Builder includes direct API access and scheduled downloads, making it easy to set up automatic retrievals for any location and date range. You can also bookmark your query links to refresh your climate data as often as needed.