

Historical humidity data is an important weather measure that is needed in various business tasks as well as being key for human comfort. Whether you are looking for humidity data to analyze moisture’s effect on a product, understand human comfort levels, or plan tasks for a building project, a weather data service such as Visual Crossing Weather can provide humidity data easily using global historical reports going back to 1970.
What humidity measures are available?
The key humidity measure is Relative Humidity. However, humidity is also closely related to Heat Index because humidity plays a major role in how the body perceives temperature. Humidity in weather analysis is typically reported as relative humidity instead of the absolute amount of humidity in the air. Relative humidity is the amount of water vapor in the air relative to the amount of water vapor that the air is able to hold at the current temperature. If the relative humidity is at 50%, for example, the air is holding 50% of the moisture that it can hold at its current temperature. Since warmer air can hold more water vapor than cooler air, 50% humidity with a warm temperature means that there is a lot more moisture in the air than 50% humidity with a cold temperature.
The way that the body perceives temperature is dependent on humidity, So, it makes sense that the heat index measure would combine both temperature and humidity to give a single value for how the body “feels” the current temperature conditions. A combination of high temperature and high humidity is the most uncomfortable for people and animals and is represented by a high heat index value. As temperature and/or humidity fall, a simple formula combines the two values and lowers the heat index. As the heat index falls, temperature conditions feel increasing comfortable.
What are the units and range for historical humidity data?
Relative humidity is given as a percentage. As explained above, this is the percentage of moisture that is in the air relative to the maximum amount of moisture that the air can hold at the current temperature. As for range, relative humidity in natural conditions can go up to 100%. When this is combined with high temperature, humans feel extremely uncomfortable. The highest temperature on record with 100% humidity was 93 F (35 C) in Jask, Iran in July 2012. People have described conditions like this as being constantly surrounded by wet cotton balls that are the temperature of a hot bath. In nature, it is practically impossible for air to contain no water vapor. So a relative humidity value of 0 has never been reported. However, extremely low values are possible. For example, Coober Pedy in the South Australia desert has reported relative humidity values as low as 1%.
Heat index values are reported as degrees in the units system selected for the query. This means Fahrenheit for the standard system and Celsius for metric. Due to the nature of the heat index calculation and how the humidity value is “added” into the temperature, heat index is typically considered valid only for temperatures above 80 F (27 F) and relative humidity above 40%. In conditions with lower temperature and humidity, the “additive” value for the humidity is calculated as a negative value. Since this would suggest that the air temperature “feels” colder than the base temperature due to humidity, the heat index value is considered invalid an typically left empty. Heat index values above 91 F (33 C) are considered as “extreme caution” values, values above 103 F (39 C) are considered “danger” values and values above 125 F (52 C) are considered “extreme danger” values. As for the maximum heat index value recorded, it was 172 F (78 C) in Dhahran, Saudi Arabia in July 2003.
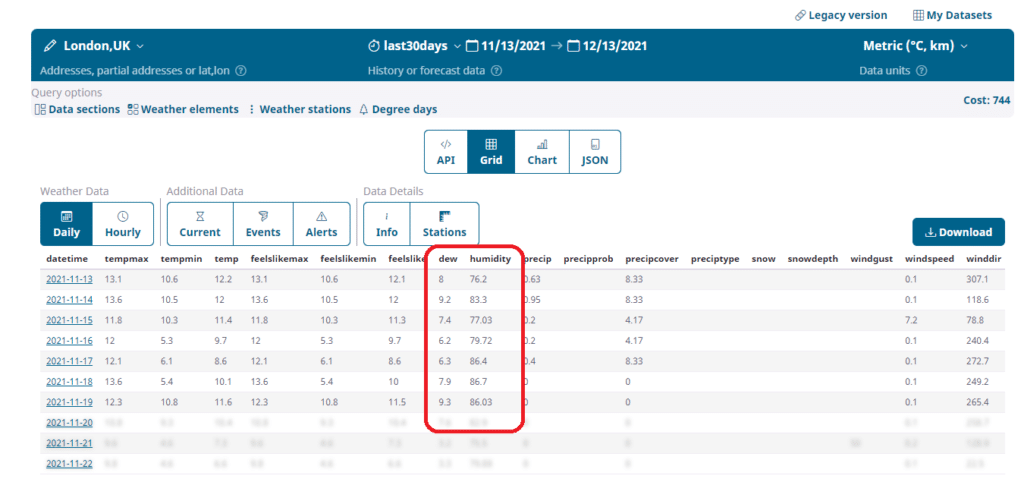
How can I find humidity data for a specific location and date (or date range)?
Visual Crossing Weather offers multiple ways to find the relative humidity and heat index for a specific location and date. One easy option is to use the Visual Crossing Weather query page to get the weather details. This is a great option if you would like to download the humidity data as a CSV file or as an XSLX for loading directly into Excel. First, sign up for a free account on the weather query page if you don’t already have one. You can then enter your location, select the date range, and submit your historical weather query. After the query is run you can view the results directly on the webpage or download the results for further analysis.
Another option is to run a query via the Visual Crossing Weather API. Using an API allows you to run your query from inside any script or code automatically. The Visual Crossing Weather API uses a simple query URL to define a weather query. You can run this URL in a command-line tool such cURL, in your own script or code, or even directly in a web browser. The query returns the weather results including relative humidity and heat index data in CSV or JSON format. CSV results are easily loaded into a database or data science tool while JSON is a format that is easily parsed in languages such as Python and Java. If you follow our how-to guide, you can learn how to run your first weather API query in just a few minutes.
Summary
Relative humidity along with its related weather measure, heat index, are historical weather measures that are very important for many purposes including managing moisture-sensitive products, understanding human comfort, and planning certain building tasks. Using Visual Crossing Weather, it is easy to find historical humidity data for any worldwide location in multiple convenient ways including the weather query page and the fully embeddable weather API for your code. Visual Crossing weather makes finding humidity data simple.
If you would like to learn more about humidity data in Visual Crossing Weather, you can read more in our data documentation.
Questions or need help?
If you have a question or need help, please post on our actively monitored forum for the fastest replies. You can also contact our Support Team.