

Determining the average temperature for an area from raw data can be challenging and time consuming. First you need a source of data. Weather Data can fall into two separate categories: Tedious and Expensive. Either you have to find the data yourself from complicated sources like NOAA/NWS or you have to pay for it from a vendor. Next you have to load the data into an analytical tool the simplest of which is Microsoft Excel or Google Sheets. Depending on how many years you wish to go back, the data may quickly become cumbersome. The next step is to normalize and cleanse the data of dirty or null values. Finally you need some basic skills to ask the tool or to calculate the average temperature. Too much? We agree.
How can I find Average Temperature
In this section we will describe in a few quick steps how to get the average temperature of specific locations
- Visit the Visual Crossing Average Weather page at: https://www.visualcrossing.com/average-weather
- Enter in a specific location such as street address, zip code or city to find the Average Temperature for that location.
- Choose the date near which you would like to know the Average Temperature.
- Click on the Load Weather Data button to view the Average Weather Dashboard
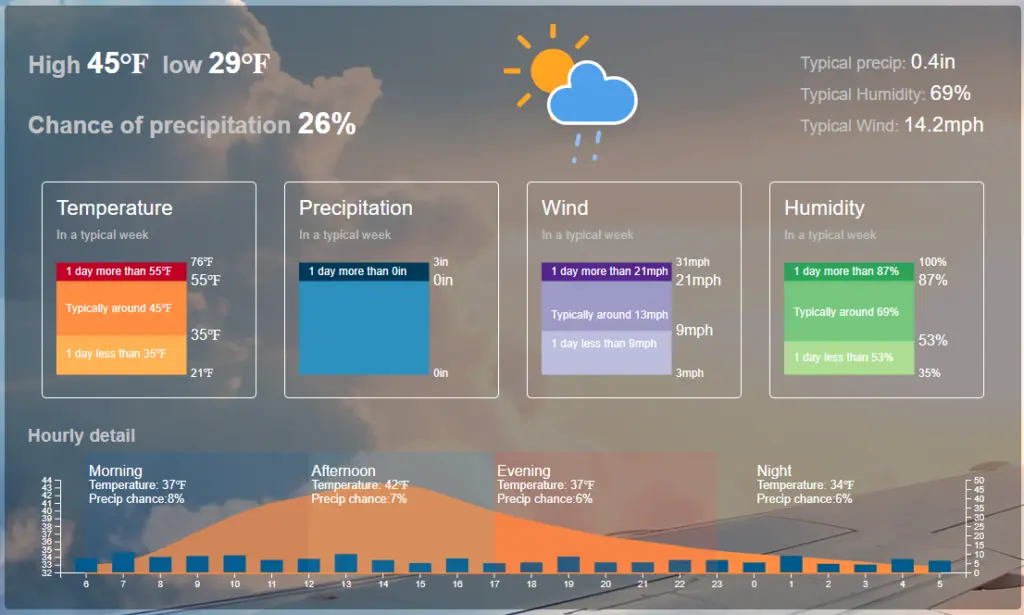
The dashboard will populate average temperature, precipitation, wind and humidity for your location using 30 years of accurate historical weather data. The dashboard will show highs, lows and average values for all weather conditions.
Average & Typical Values
At the top left of the screen you will see the Average High Temperature and the Average Low Temperature. These use the historical highs on and around the date you entered for the last 30 years. The Typical Values at the top right follow the same standard to allow you to understand what you can expect from the weather on the date and location you entered
Ranges
The graph distributions in the middle of the screen for Temperature, Precipitation, Wind and Humidity go a step further and tell you what the absolute maximums and minimums are for each weather condition. This way you can see what is “possible” for weather at this location. Also it does a full distribution to show where most historical values typically fall in the range of.
Hourly Histogram
The last piece to the Average Weather Dashboard is the hourly distribution. The orange graph will tell you the mean temperature by hour of day and show the 8 hour segments of the day for easy readability of the graph.
Quick and Easy
The dashboard is the easiest way to find Average Temperature and completely eliminates the need to download, load, cleanse and calculate these values on your own. Please let us know what you think at info@visualcrossing.com.