

This article shows the necessary steps to quickly and easily load weather forecast data for any location of the world into the cloud solution ‘Qlik Sense’ for further analysis. The tutorial shows step-by-step how to construct the query in the Visual Crossing Weather web interface, how to access the automatically generated connection string and then create a data connection for the weather forecast results to analyze it in connection with your business data in your Qlik Sense App.
If you are interesting in how to import historical weather data into Qlik Sense , be sure to check out or weather history API.
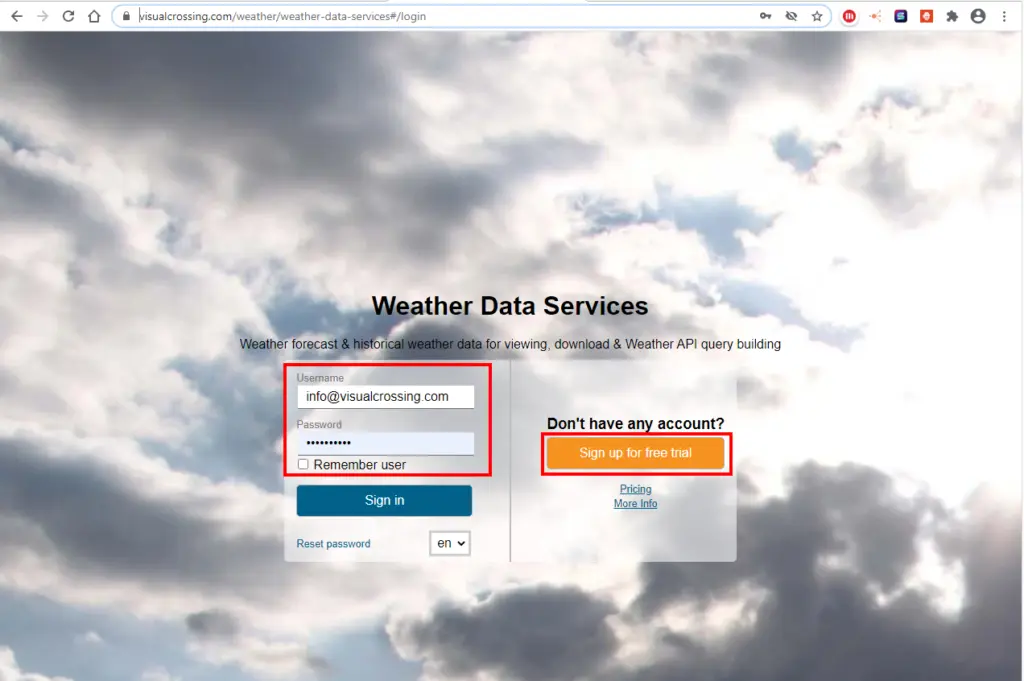
Step 1 – open Visual Crossing Weather Data Services
Open the Visual Crossing Weather Data Services log-in page and sign into your Visual Crossing Weather account. If you don’t already have an account, you can sign up for a free trial on the same page. Signing up for a free trial account will give you immediate access to a full 15-day weather forecast for any location.
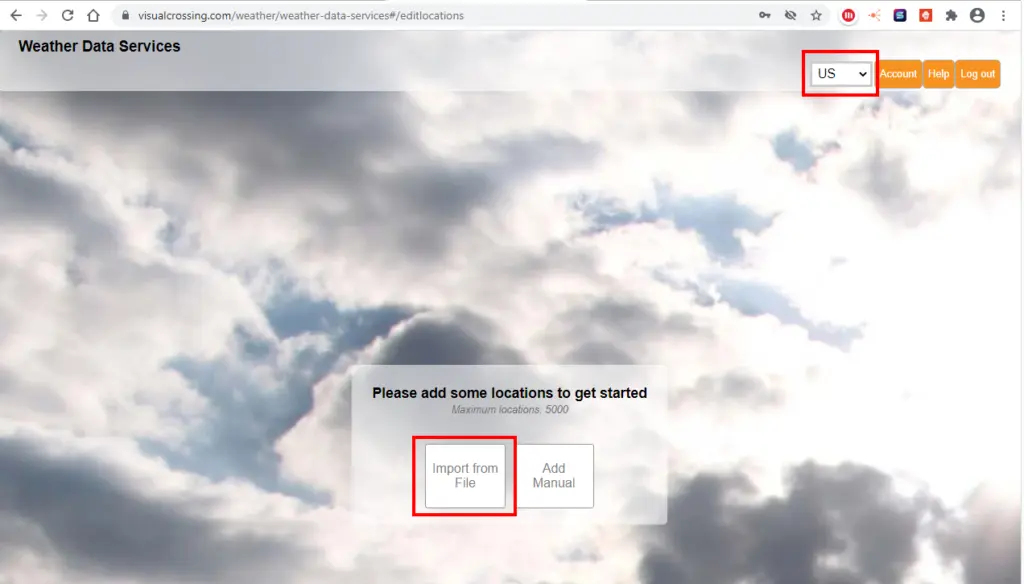
Step 2 – specify your locations
The first page will prompt you to add the locations to retrieve the weather forecast for. There are two options in the web interface to manually add locations. As direct entry of either the physical address in clear text or as bulk entry in form of a file upload. The following steps refer to the file upload option – for more details please see the Visual Crossing Weather Data Tutorial section
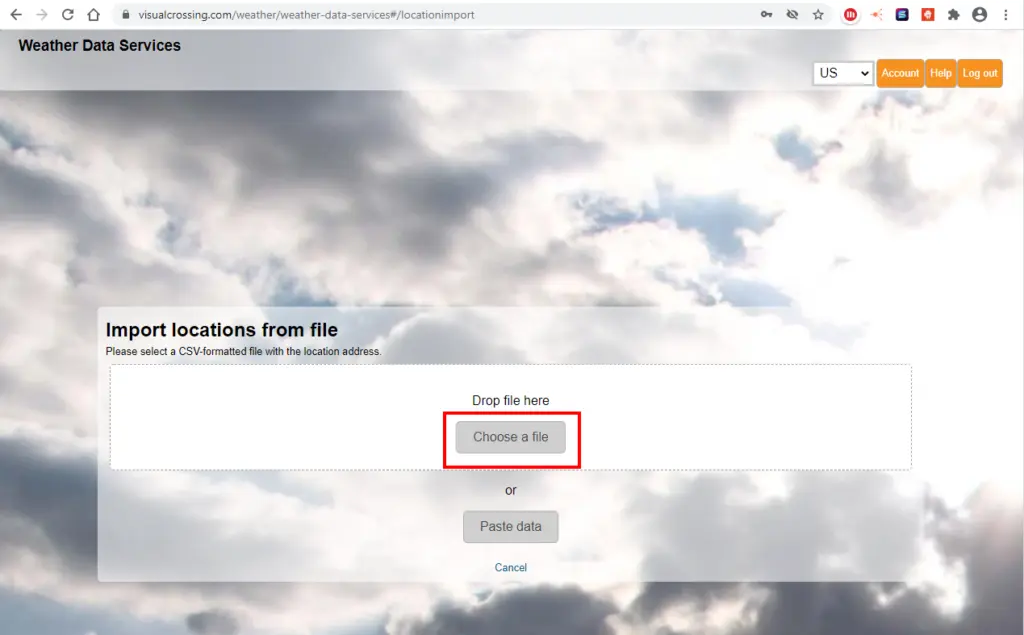
Step 3 – import locations from a file
The next screen will prompt you to select the file containing your locations of interest. You can browse to the file on your hard disk. simply drag an drop it to the corresponding section or paste the content directly into the web page.
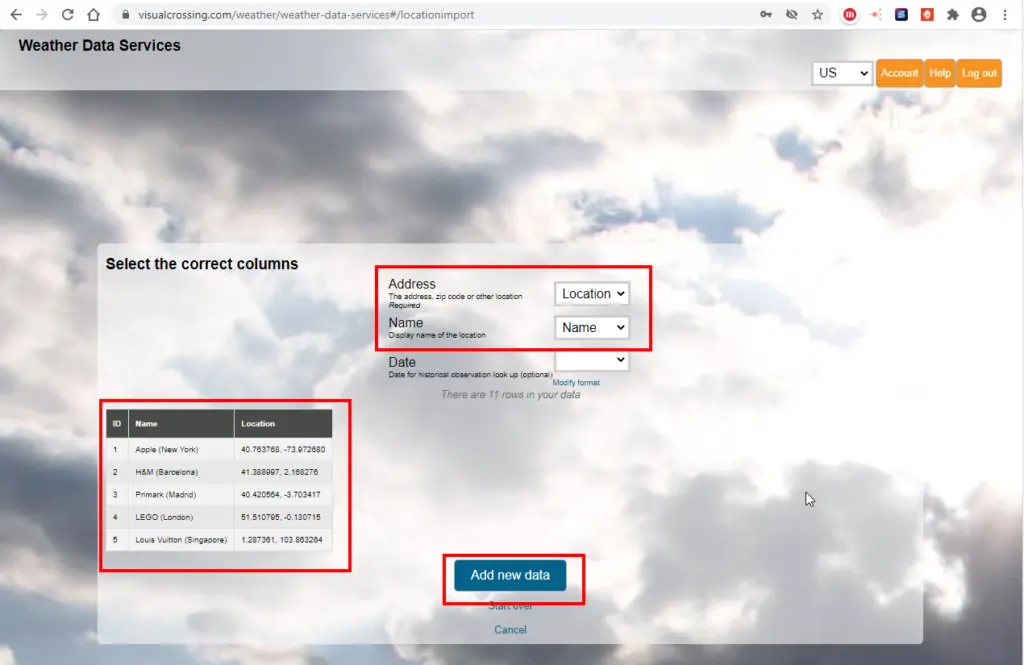
Step 4 – configure the location information
In the ‘Select the correct columns’ form, select the the address and the name column of your data set. For the forecast you can ignore the date column which refers to the retrieval of historical data. The address can be a Latitude / Longitude pair as well as simply address, a city name, or a postal code. For convenience you see a preview of your data set. Once finished press the ‘Add new data’ button at the bottom
Step 5 – Request Weather Forecast Data
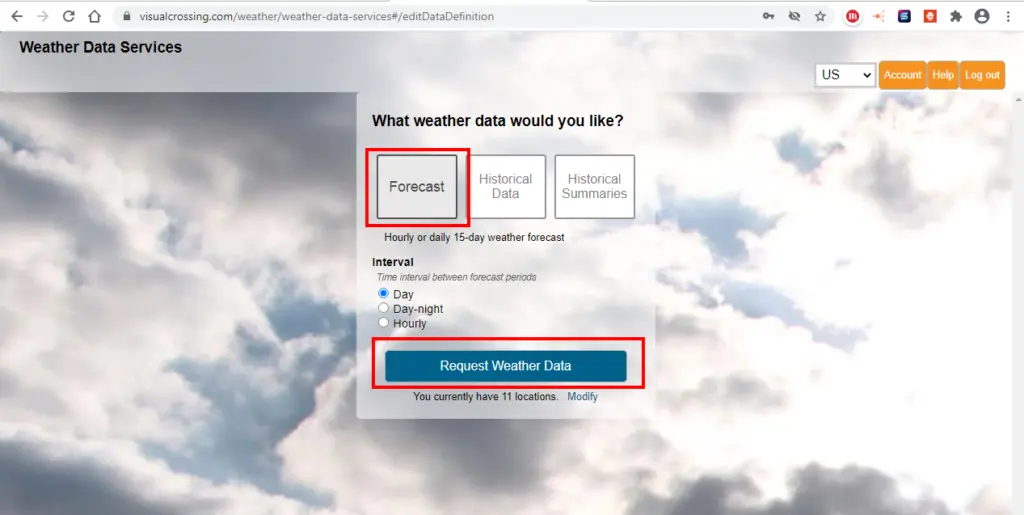
On the next page you can select the type of data you want to download.
The options are forecast, weather history queries, historical data summary reports, and hourly data. This tutorial will continue with the daily forecast option. Please see those or reach out to us if you need more information on the other options or browse our tutorial and video section for more details.
Select the forecast option and click the ‘Request Weather Data’ button.
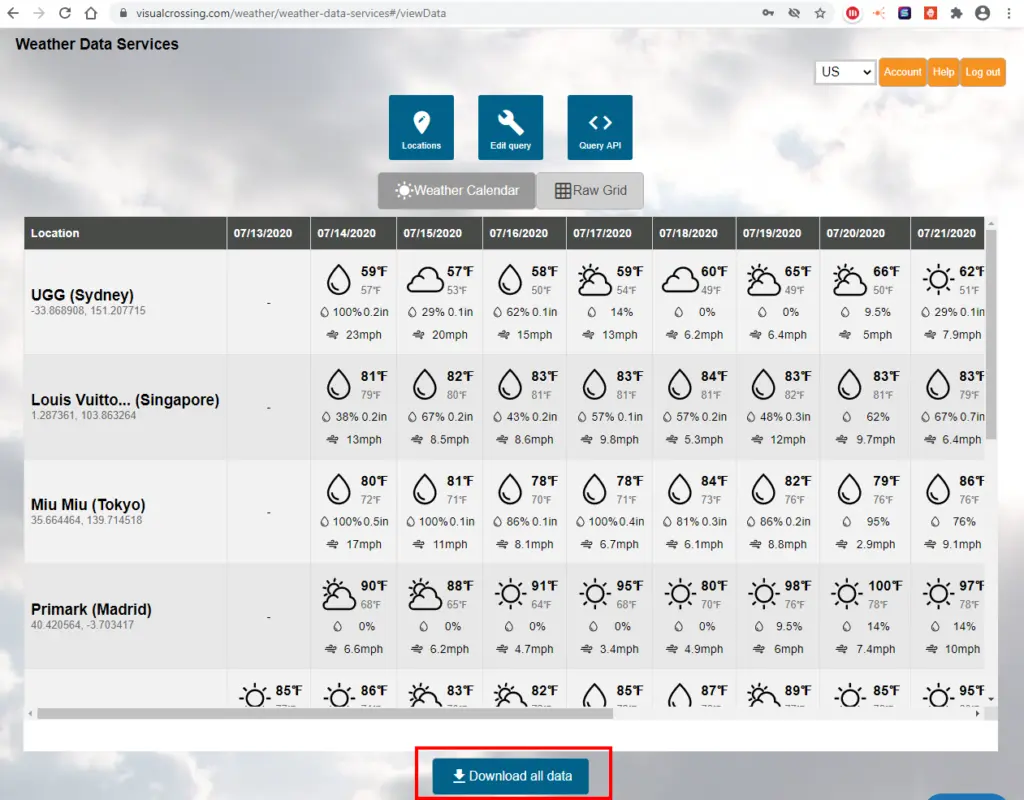
Step 6 – review the weather forecast data
The default view for the query results is the weather calendar. This view provides a simple overview of the result data.
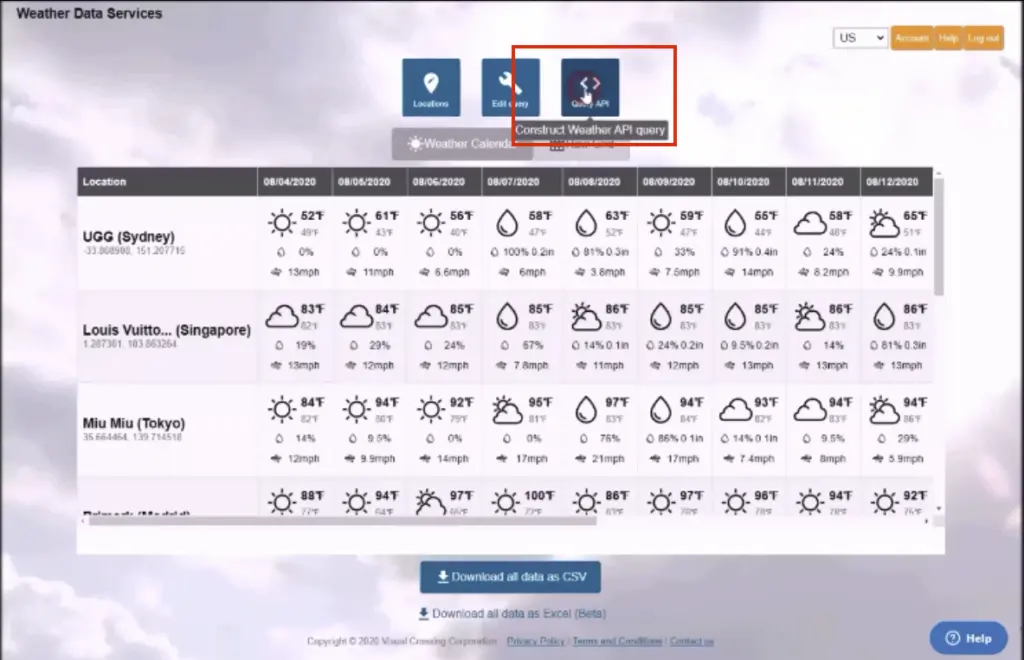
Step 7 – Generate the Query string
To automatically generate a query string for your locations click the ‘Query API’ button
Step 8 – Select query options and copy the string
The query can retrieve data using GET, POST or ODATA. For the Qlik Sense use case please select GET.
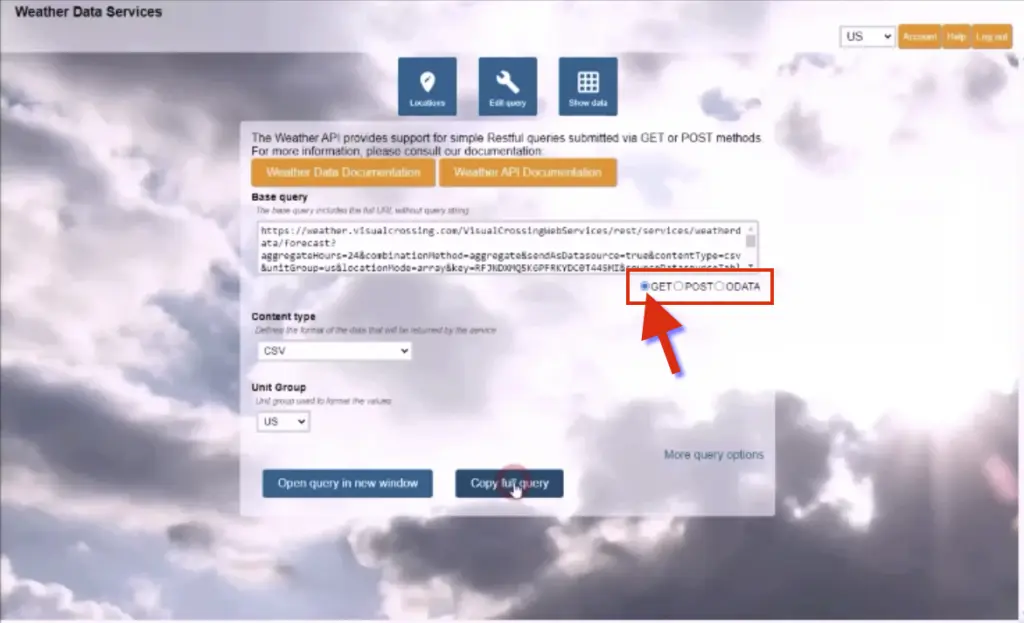
The ‘Content Type’ section allows to chose between CSV and JSON data format. The Qlik Sense REST interface support both formats. In our scenario CSV is read as a single table and hence easy to analyze – so we will proceed with this option.

Besides the unit group drop down (US, Metric, UK) you have additional option in the ‘More query options’ section. For the details please see our ‘Getting Started Guide’. To copy the query string to the clipboard click the ‘Copy full query’ button.

Step 9 – Log in to your Qlik Sense Hub and open an app
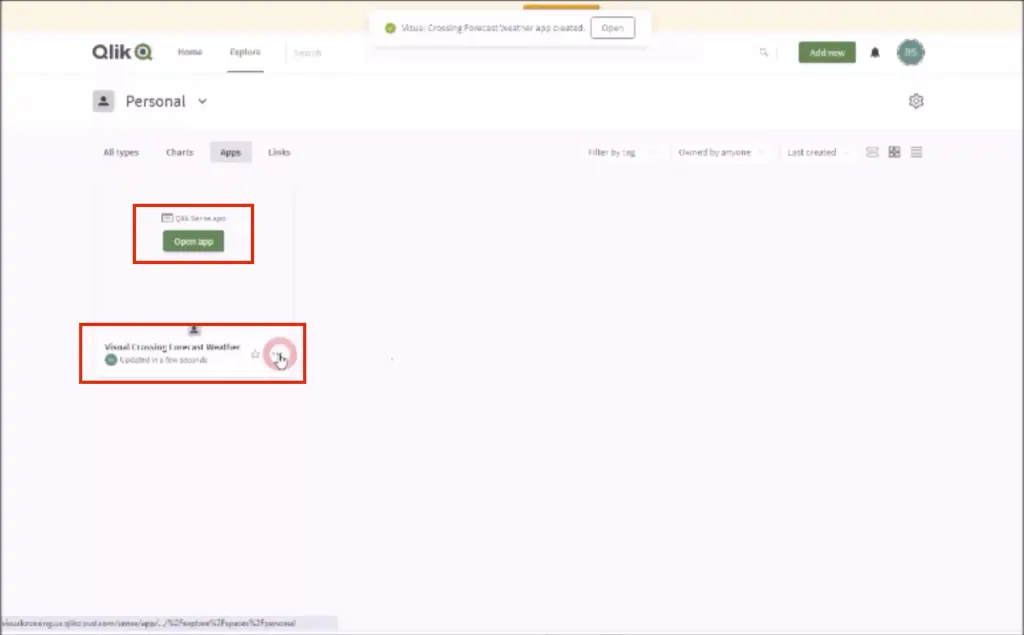
Login to Qlik Sense and select the app you want to add the weather information to or, in case you do not have a suitable app already, create a new one by clicking the ‘Create or upload an app’ button.

Please open the app you want to add forecast weather to or the one just created.
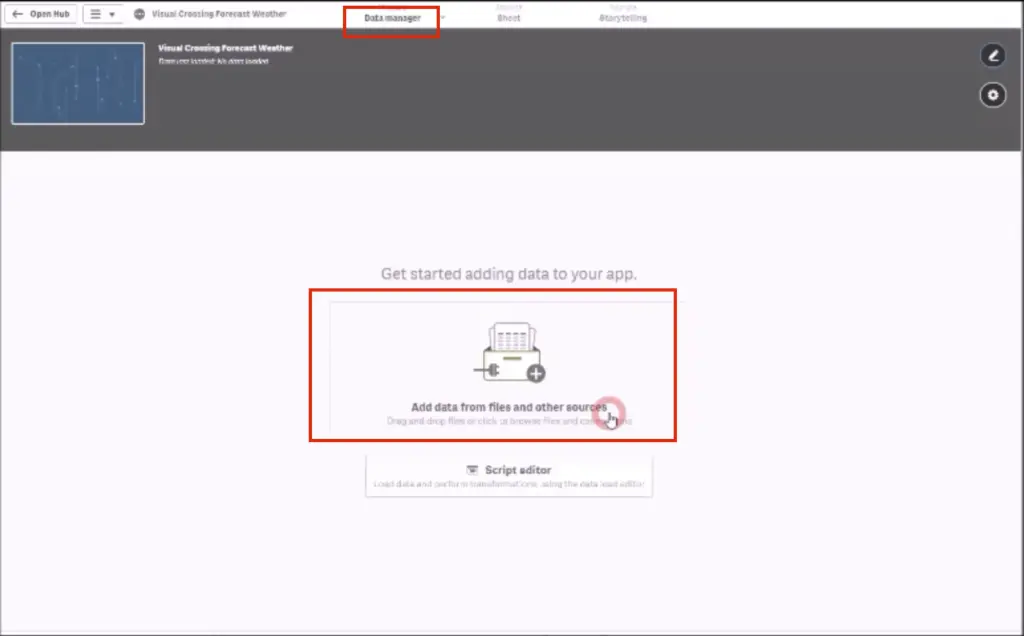
Step 10 – Add the weather data source to your app
In case of a newly created app click the ‘Add data from files and other sources’ filed. If you have an existing app you can open your ‘Data manger’ from the menu bar as well.
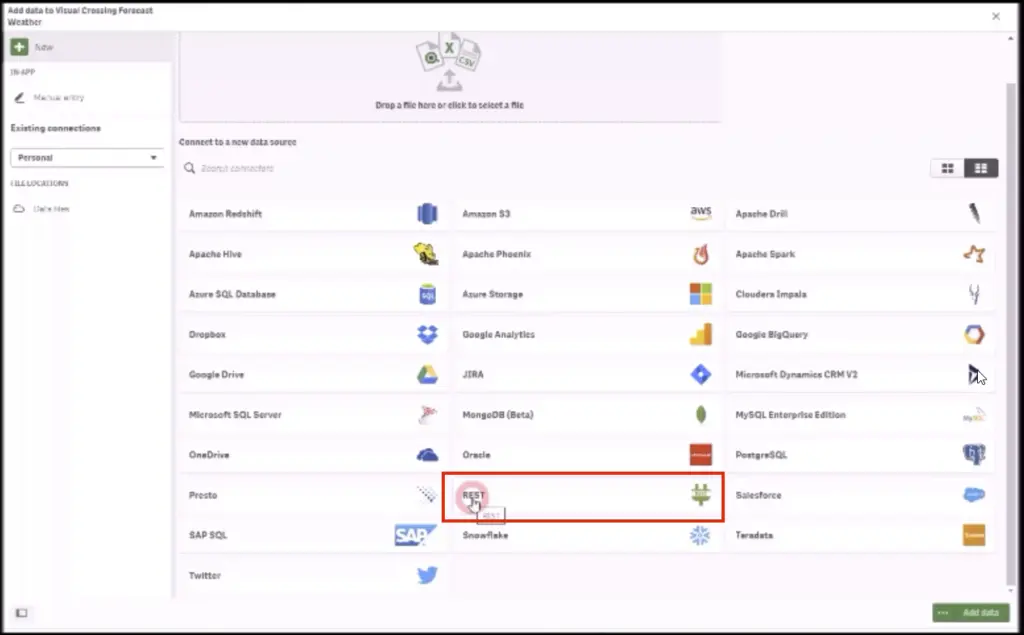
Step 11 – Connect to Visual Crossing Weather data using a REST connection
The connection editor shows a list of data source connectors. To connect to the Visual Crossing Weather Data Services please select the ‘REST’ entry.
Step 12 – Set the connection parameters
Paste the connection string generated in Step 12 into the URL a field, make sure your ‘Method’ drop down is set to ‘GET’, give he connection a suitable name and hit the ‘Create’ button.
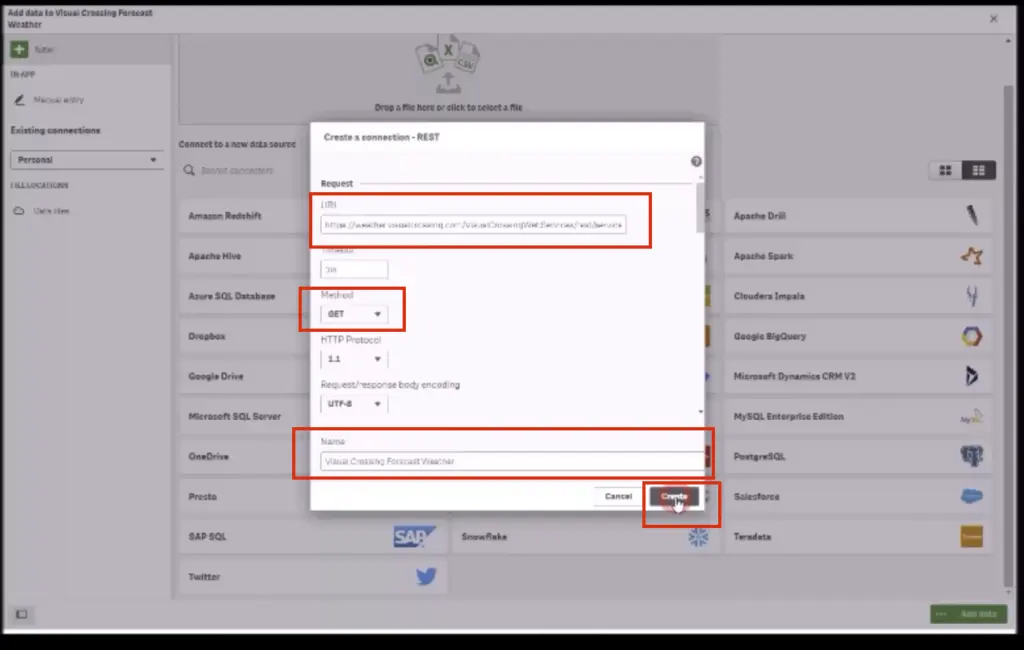
NOTE: the other parameters can be set to default or changed according to your requirements – the preferred HTTP protocol is 1.1.
Step 13 – Review your results and add the data to your app
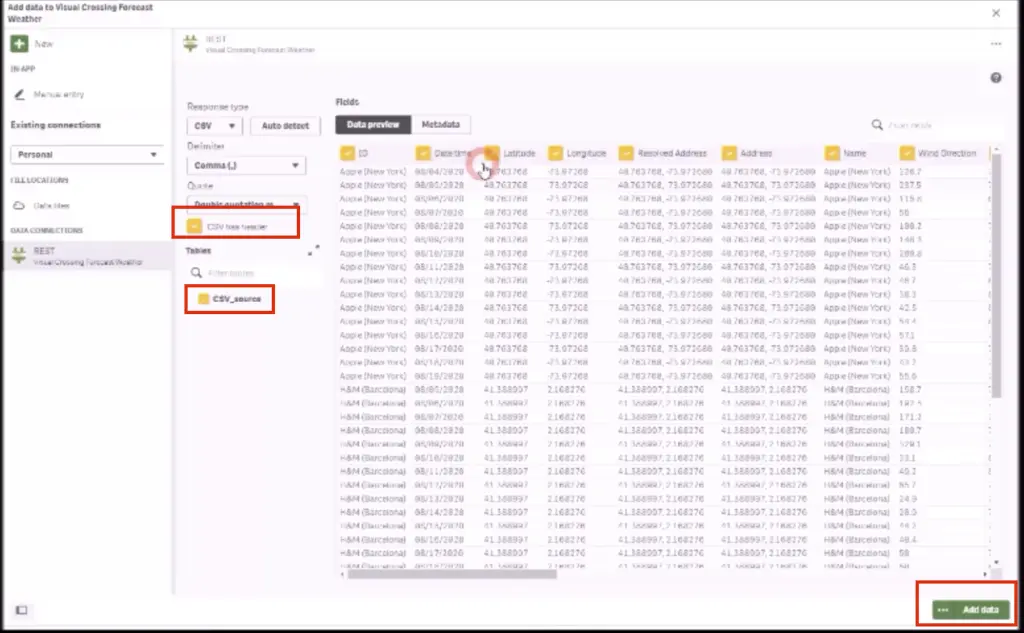
In the preview window check the ‘CSV has header’ box in order to get a correct naming of your columns. Check the ‘CSV_sources box to get a data preview and click the ‘Add data’ button.
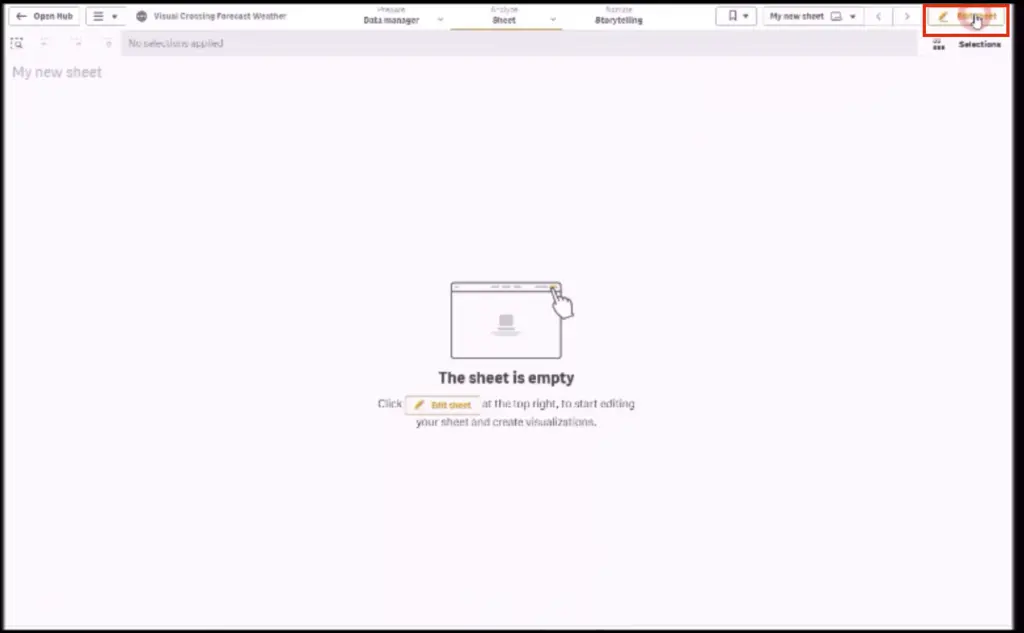
Step 14 – Start your analysis in Sheets or Storytelling
Click the ‘Edit sheet’ button on a new sheet to start your analysis based on the weather forecast data for your business locations.

As you can see, importing weather data into Qlik is simple and straightforward.
Questions or need help?
If you have a question or need help, please post on our actively monitored forum for the fastest replies. You can also contact our Support Team.