

Downloading historical weather data for multiple locations provides a fast and simple way to enrich your business data in Oracle Analytics Desktop with matching weather parameters to analyze their impact on business. This article shows the necessary steps to generate weather data for any location of the world and how to load it into Oracle Analytics Desktop. The tutorial includes as well step-by-step instructions how to construct the query in the Visual Crossing Weather web interface necessary to download the weather data file.
Step 1 – Log into Visual Crossing Weather Services and upload your locations
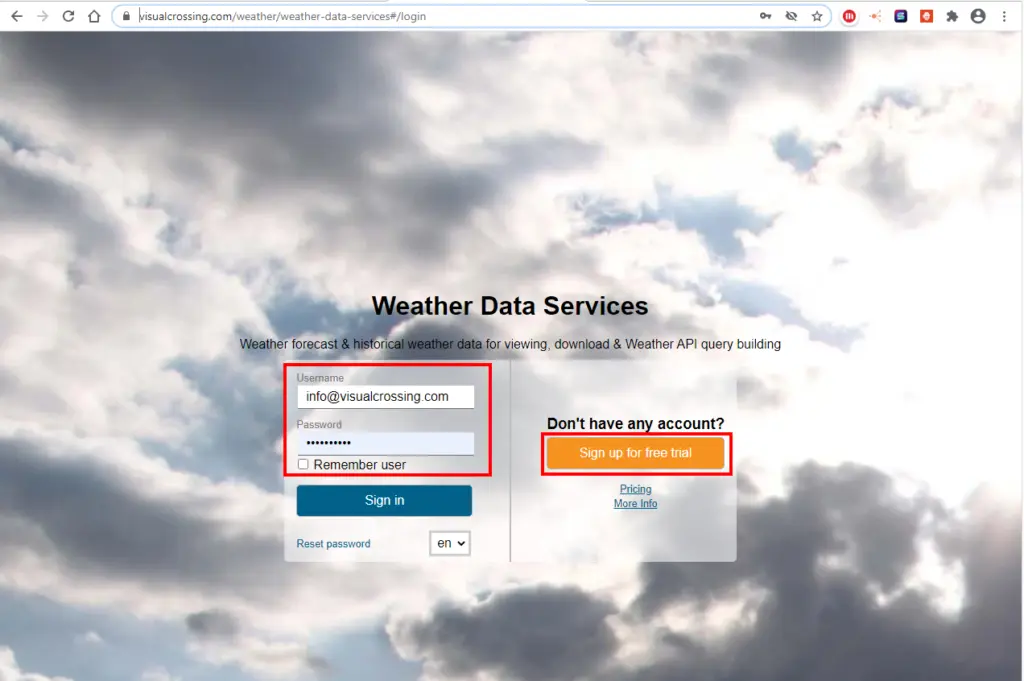
The first step is log in to Visual Crossing Weather Services. if you don’t have an account, you can create a free one. The necessary steps are outlined in detail in How do I load weather forecast data into Oracle Analytics Desktop
Step 2 – Request Historical Weather Data
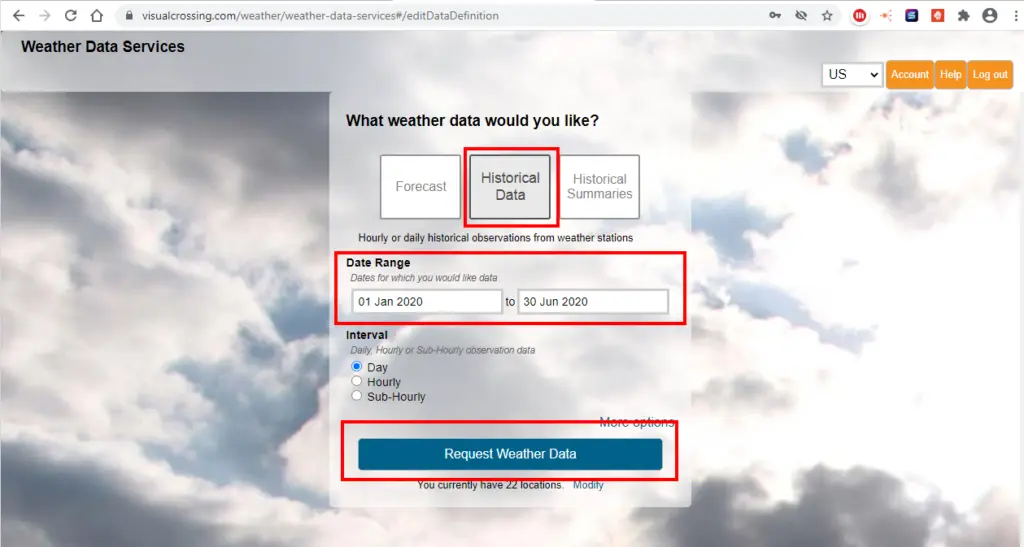
On the query type selection page you can select the type of data you want to download.
The options are forecast, weather history queries, historical data summary reports, and hourly data. The tutorial will follow the steps for the option ‘Historical Data’. Please see those or reach out to us if you need more information on the other options or browse our tutorial and video section for more details.
Select the ‘Historical Data’ option, chose your time frame and click the ‘Request Weather Data’ button . Fro this example we chose the first quarter of 2020.
Step 3 – View and download the historical weather data
The default view for the query results is the weather calendar. This view provides a simple overview of the result data. To see all columns you can switch to the ‘Raw Grid’ mode as well. To further analyze the data you will need to download the full data set by clicking the ‘Download all data’ button.

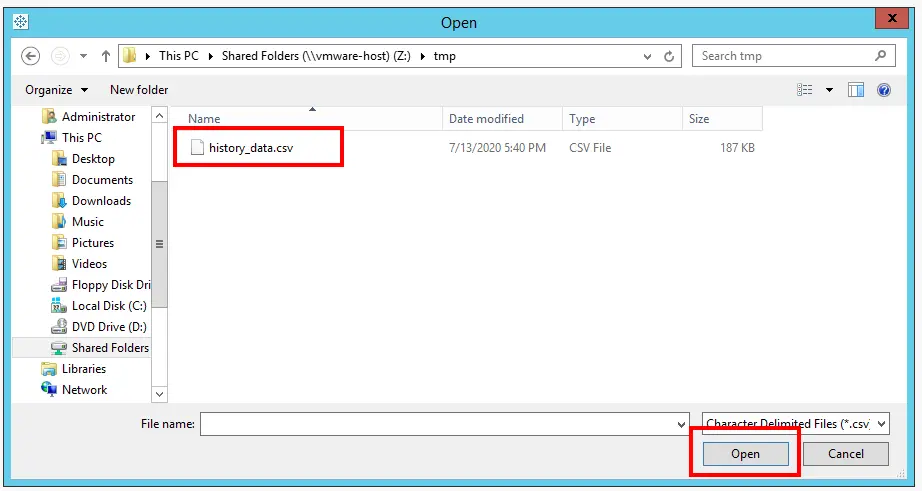
Step 4 – Load your historical weather .csv file into Oracle Analytics Desktop
This follows the standard upload mechanism of Oracle Analytics Desktop. You can find the details as well in our How do I load weather forecast data into Oracle Analytics Desktop? Tutorial under Step 7 and Step 8.
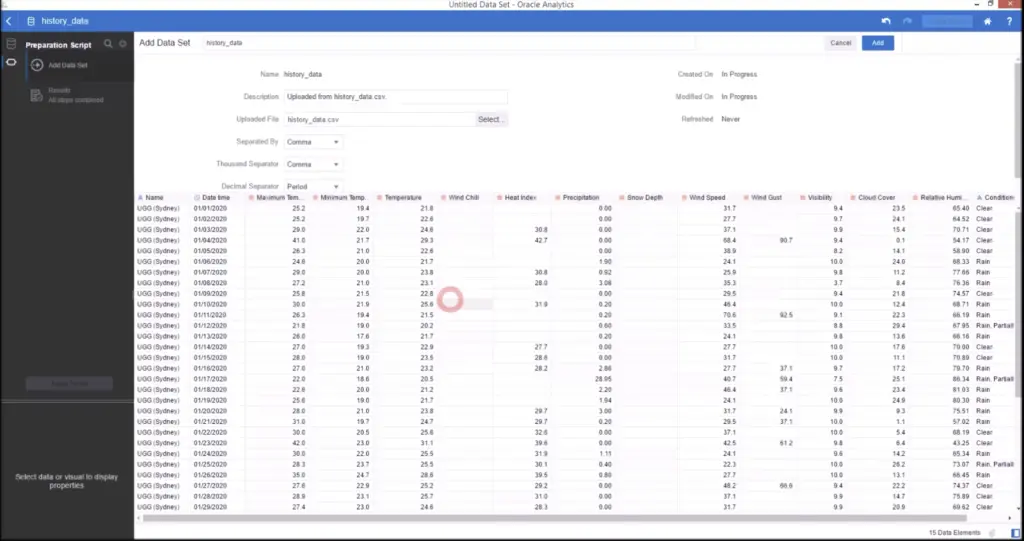
Step 5 – Review and link your weather data
Oracle Analytics Desktop now displays the full data set containing the weather metrics for the selected time frame. The metrics include common values such as temperature, precipitation, and wind as well as less common value such as heat index, cloud cover and wind gusts. For more information on the details regarding our weather metrics, please see our Weather Data Documentation. In the same view you can add additional tables containing business data to relate your relevant measures for the selected locations.
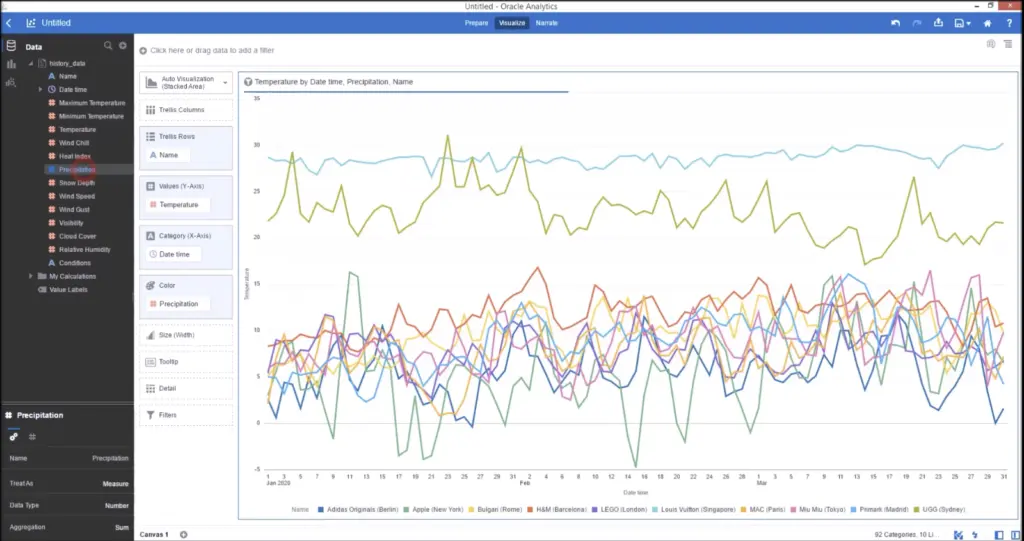
Step 6 – Create weather data analysis
Now the weather data is loaded into Oracle and you can start your business analysis using the full functionality of your Oracle environment. Like in the below example visualizing the precipitation over time for your flagship store locations.
Closing thoughts
As you can see, importing both weather forecast and historical weather data into Oracle is very straightforward.
Questions or need help?
If you have a question or need help, please post on our actively monitored forum for the fastest replies. You can also contact our Support Team.