

PART 2 – CREATING AN MICROSOFT EXCEL GARDENING WEATHER FORECAST
In our previous gardening weather blog, we set up a Microsoft Excel workbook that displays a summary of the historical weather information for a location targeted towards the gardener. With the historical Excel workbook, we can understand the climate that they can expect for a particular location. Using this climate and weather knowledge, we can make decisions on what and when to plant.
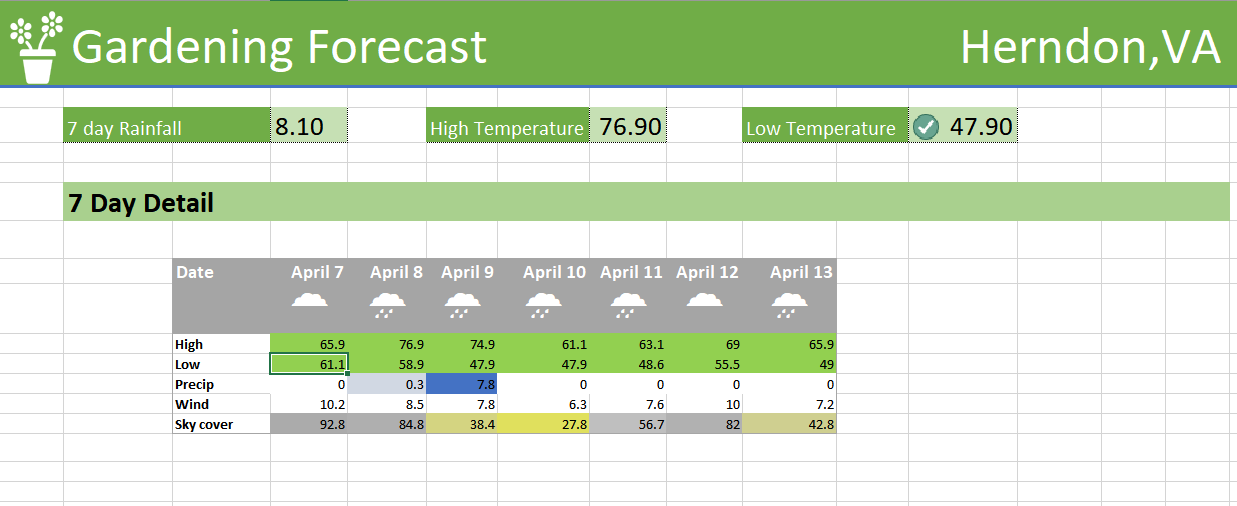
In this edition we will add a second worksheet to our Gardeners Weather Workbook to summarize the weather forecast for the coming week. Using this information we can then plan our gardening activity and understand whether the weather will affect the garden in a way we need to plan for – will it rain? will it be hot? will there be a frost? Here’s how our forecast dashboard will look.
Importing the forecast weather data
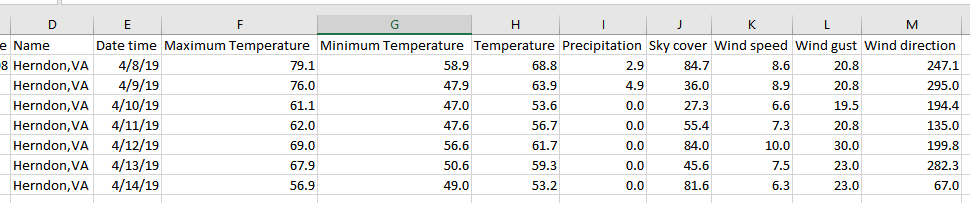
To start creating the workbook we need to import forecast weather data for the locations we are interested in. To do this, we are again using the Visual Crossing Weather add-in. This add-in makes it easy for us to import forecast weather data into Excel.
In our raw data sheet, we copy the location address from the first page of our Workbook. The Visual Crossing add-in uses the location address to populate a table that includes the weather forecast. This information can be refreshed on demand. We can add weather forecast data for different intervals – summarized by day, half day or hour. In this simple example we are going to use day-level weather forecast summaries.
Weather forecast summary
We first create a nicely formatted weather forecast table, so we can see the forecast for the next seven days:
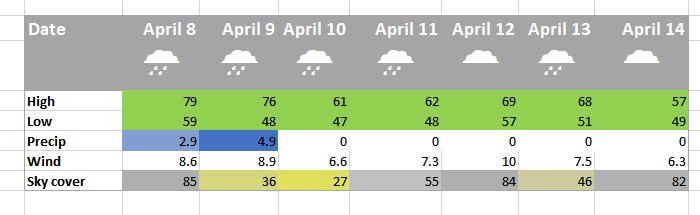
Each of these are simply references to the raw forecast weather table. In addition, we then added conditional formatting to help highlight days that are hot, cold or when rain expected.
Finally, we added conditional icons using the ‘webdings’ font. These give the forecast table an easy to use summary of the expected weather conditions.
=IF(D14>0,"Û",IF(D16>75,"Ù",IF(D16>25,"Û","Õ")))
Produces the desired icons when the webdings font is selected.
Next Part – Create a Growing Degree Days Calculator using Historical and Forecast Weather Data
We can see that creating a weather forecast summary is very straightforward. Simply bring in the weather forecast data using an external provider such as Visual Crossing’s Weather Add-in and then create a formatted forecast table. In our case we also extracted some of the key aspects of the weather forecast that a gardener would like to see.
In our final part of the blog series, we will combine what we have learned in creating our historical and forecast worksheets into a third worksheet where we will create a Growing Degree Days Calculator using Historical and Forecast Weather Data, so we can track how the growing season is progressing.
If you would like to download the completed Microsoft Excel workbook, you may download it here: Gardening_Weather_Workbook.xlsx