

One of the most closely watched consequence of the war in Ukraine is the increased cost of winter heating for the winter of 2022-2023. As of this writing in October 2022, the price of natural gas in Europe has increased more than 600% over last year. While Europe was heavily dependent on Russian gas ahead of the war, the US has not been spared either. US gas prices have increased over 160% over 2021 prices. In addition to those who heat their homes directly with natural gas, a significant percentage of electricity is produced using natural gas as well. In the US that percentage is more than 38% while Europe is a less at nearly 24%.
When it comes to home heating, these two sources, natural gas and electricity, dominate the home heating marketing. In Europe, 70% of heating comes from one of these sources while in the US, the percentage is nearly 87%. This means that a dramatic increase in gas cost will affect the winter heating cost of millions of homes.
Many eyes are also on the weather as it evolves over the coming months. The US National Weather Service has forecast La Niña conditions for this winter season. (Note that La Niña is effectively the opposite of the better known El Niño. For those interested in science, you can read more about the metrological and oceanic conditions behind the two event here.) Since La Niña events typically means a warmer, dryer winter for a large part of the US, this prediction is generally welcomed by those in the US who are concerned about heating costs this winter. However, this is not the same prognosis for Europe. La Niña is typically associated with colder winters in Europe and the UK. So, it is possible that the region experiencing the most significant energy cost impacts due to the war in Ukraine will also experience colder than usual temperatures to magnify their misery. (As a silver lining, however, European skiers as well as those in the Pacific Northwest may be treated to above average snowfall making conditions great for those who love winter sports.)
How can I track the costs of heating this winter?
If your home is equipped with a smart thermostat, the app that controls it likely has a feature to track your energy usage throughout the season. The best ones combine not only past and present energy usage but also bring in historical and current weather data to help you understand how your choices combine with external conditions to affect your bill.
However, if you don’t have access to a smart app to track your heating or if you are interested in energy usage for areas outside your own home, we have developed a free web-based dashboard to help. The Visual Crossing Winter Energy Calculator combines weather conditions, energy price data, as well as standard heating models for various home types. The weather data is updated constantly using our Visual Crossing Weather API. Using this data, the dashboard can track temperature swings day-by-day throughout the entire winter season for every location around the world. The energy data is sourced from public data sources primarily in the EU and the US. In addition, crowdsourced data is used to give a more complete picture of consumer energy costs. You can contribute by contributing your energy cost information. Simply click on the Create a usage model using your own usage link on the dashboard and follow the wizard steps.
In addition to adding energy costs information, you can also import a more accurate energy usage model for your own home. You provide the information using the same wizard discussed above. In most cases, the information can be pulled directly from your energy bill, energy provider’s online site, or even your own smart thermostat logs. Once imported, your model will remain available to you all season and can provide more accurate analysis of your heating energy usage vs. the standard home models that are provided by default.
How can I use the Winter Energy Calculator?
The basic usage of our free Winter Energy Calculator is as simple as navigating to it and selecting a location. This location can be your home address, in which case the dashboard will be based on the exact weather conditions for your location. If you prefer a different location, you can select a city from the strip along the top of the dashboard window or enter any global location.
Based on your location, the dashboard will automatically select an appropriate currency and energy model. However, you can manually change these at any time. Note that due to the geo-political turmoil at the time of this writing, the default dashboard settings focus on Europe and the US. However, this can be expanded based on your needs and input. If you have suggestions for how to improve this dashboard or want to give feedback about your experience using it, please email our Support Team.
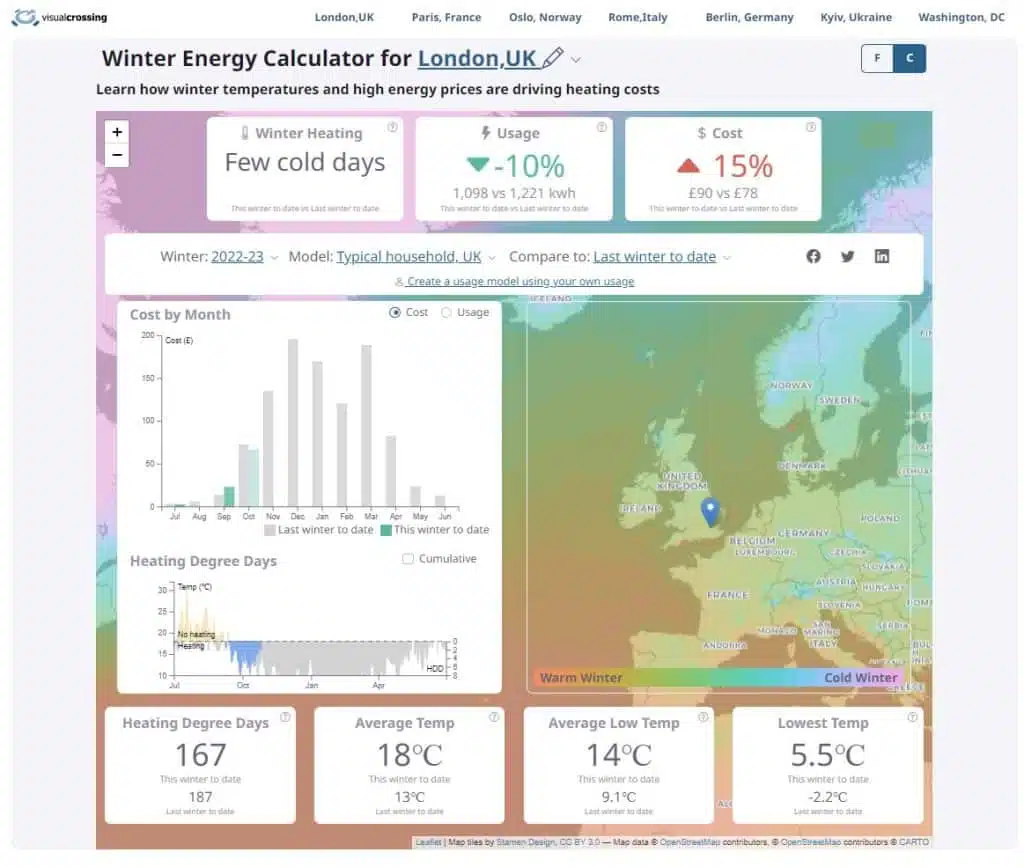
In the screenshot above, you can see an overview of the dashboard. The map background shows a color gradient of the winter temperatures during the season so far while the KPIs at the top provide an overview of the winter temperatures and heating conditions to date. Based on the energy prices and heating model, the dashboard calculates the expected energy usage and cost relative to the previous year.
The main graph in the middle shows the heating cost or energy usage month by month depending upon the selector (in the upper right-hand corner). You can quickly see the elapsed months of the current year (in green) vs. the months of the previous year (in gray). This shows you a direct visual comparison between the heating data for this year and last year. The smaller graph below that shows the Heating Degree Days values as the season progresses.
The bottom set of KPIs shows the total number of Heating Degree Days and the temperature values so far this season and how they compare to last season. This set of values helps you understand the specifics of this winter vs. last regarding weather. As mentioned above, Heating Degree Days is a key, fundamental concept when calculating heating cost. It is defined as the total number of temperature degrees that must be added to the building over the entire period. For example, a day where the outside temperature is 20 degrees below the inside temperature would count as 20 Heating Degree Days. That is because it building temperature needs to be raised by 20 degrees in order to be at its comfortable temperature. If you have five days like that in a row, that 5-day period would take 100 (20 * 5) Heating Degree Days to ensure that the building stays at the desired temperature. Beyond this, factors of home size, insulation, etc. come into play. Our calculations for that component is either based on the “typical” home sizes and types built into the dashboard or on your own custom model if you choose to enter your own data.
Summary
The Visual Crossing Winter Energy Calculator is a powerful tool that pulls in data from many sources including historical and forecast weather data, prices from energy markets, and various models based on typical home sizes. You can also add your own home details in addition to the default values for a more exact view of your specific home. Of course, many of these values, especially the defaults, are based on generalizations. So, many values shown on the dashboard are estimations. The usefulness of the dashboard is not to give a precise energy cost value for any specific home. Instead, the value is to be able to combine weather data with public and crowdsourced energy data to help people better understand the heating costs connected to extreme energy price and the weather conditions in Europe and the US this winter.
Further Exploration
If you would like to understand how the Winter Energy Calculator was made, we have created an article that delves into the technical details. There you can learn more about the data sources and how the energy models work. The various components of this dashboard can help you in building your own application based on weather data, heating calculations, energy costs, and more.
If you have ideas for how to improve the dashboard of if you believe that you see something amiss, please send an email to our support team. Due to the volume of requests, you may not receive a personal response, but our team will personally read every suggestion and look into all bug reports submitted. So, thank you for using the dashboard and that in you in advance for your help with improving the Winter Energy Calculator to make it more useful for everyone this winter.