

Insurance professionals are often called upon to verify insurance claims to see if they make sense given the surrounding circumstances. Frequently those claims involve questions relating to weather. For example, the claimant may report that a heavy storm toppled a tree onto a shed. Did a storm with destructive winds likely come through the claimant’s area on the date in question? Another example relates to a car accident. The driver may report rainy or icy conditions being the primary factor in their fender-bender. Was it really raining during the time of the accident question? Was it cold enough to be icy in the area?
In this article, I’ll show you how to use historical weather data to quickly and easily find the weather conditions for any specific time or time range. This will allow you to determine if the weather conditions at the time of an insurance claim event could reasonably have been a factor.
Our monthly plans now include historical reports for hail, tornados, wind damage and earthquakes. For more information see how you can add historical weather damage reports to your queries.
Solving the Problem Using Historical Weather Data
If you have a single event at a specific date or time, finding the matching weather reports is quite easy using a tool such as Visual Crossing Weather. First log into your Visual Crossing Weather account. If you don’t already have an account you can sign up for a free trial on the login page.
You will first be prompted to manually enter the incident location. Simply enter the address as free-form text. It will be automatically converted to the proper latitude and longitude in a process known as geocoding. You will initially see a 15-day forecast for the selected location. However, you can easily change the date to be any date in recent decades. To do so, click on the blue bar where is say “15-day forecast.” This will give you the calendar control shown below.
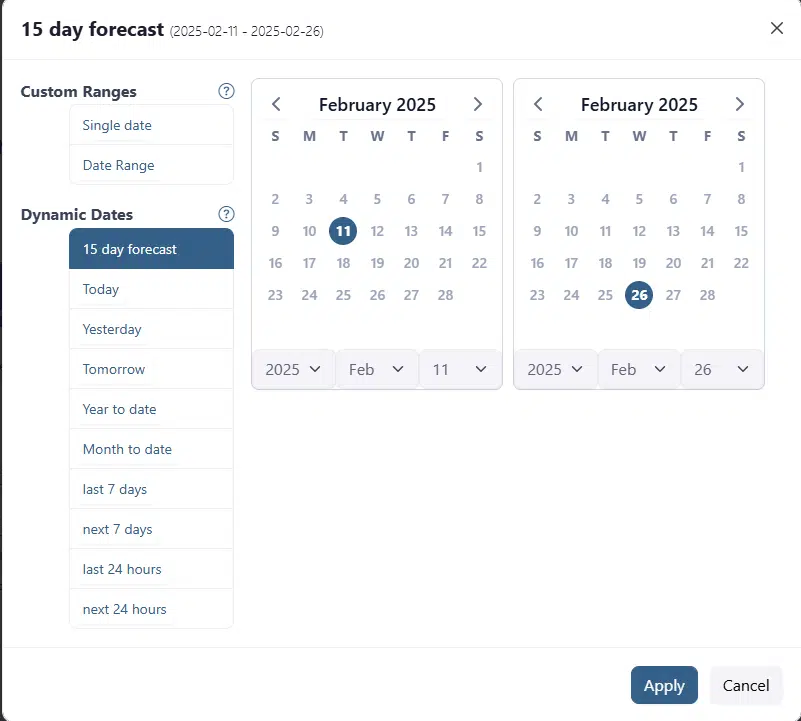
When you click the Apply button, you will now see the weather reports for the location on that day. If you want to view hour-by-hour data throughout the requested day, you select the “Hourly” button on the tollbar. If you are preview mode, you will be able to see a first few rows of data. However, if you click the “Switch to full dataset” option below the grid, you will be able to scroll through the grid to see the data for every hour in the day. The weather records will show you exactly what it was like at that location at the specified time.
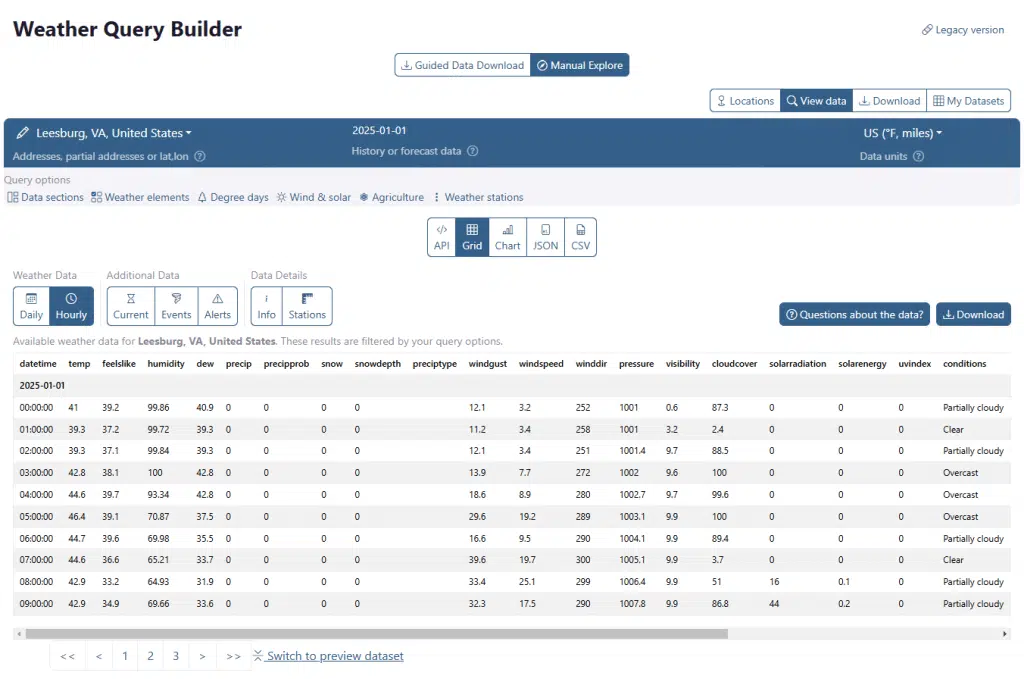
In the example that I used, you can see that is was cool but not overly cold on the morning of January 1, 2025. Also there was no precipitation. So it is unlikely that the roads were icy or vision limited due to rain or snow. Likewise, we can see that although there was a small breeze, the wind gusts were unlikely to cause any damage. (Wind gusts below 40 mph typically do not cause damage.) Of course, for more serious analysis, you likely will want to download this data to analyze further or perhaps turn into a presentation.
Delving Deeper
Sometimes you need more detailed data than this basic example provides. One more complex scenario is when storms and rain over a period of several days cause damage or dangerous conditions. Analyzing these cases with Visual Crossing Weather is also easy. To select a more broad date range, simply use the date selector to pick a starting date well before the incident. Typically, 3-5 days before is a good period to analyze. You can use the hourly weather records to see the conditions the led up to the event. In this case you will want to use the download option mentioned above to analyze the data in the tool of your choice such as Microsoft Excel.
Another scenario is when you need to analyze data at multiple locations for comparison. In some cases you will want to analyze the same time window across all locations while in others you will need to analyze different dates for each location. This is also easy. To add more locations for the same date range, simply click on the location name in the upper left-hand corner of the blue bar. You can then add locations to compare on the web to to download for further analysis. If you have locations already entered into a spreadsheet, you can save time by loading them directly from a spreadsheet. You can use this option to quickly import many locations for bulk data downloads.
You may also want to download these historical weather records for various purposes including further analysis in a tool or to include in a report. To do so, simply click the Download button on the to the upper right of the grid. The data can then be printed or imported into any analysis tool. If you prefer to work in Microsoft Excel, you can make a direct connection to your live results. The query results can be loaded directly into Excel via a URL.
Why use Visual Crossing Weather?
Visual Crossing Weather has many features that make it ideal for insurance analysis. Some of those feature include:
- High-quality, accurate hourly and daily weather records
- Ability to enter locations as free-form text addresses
- Easy-to-use query interface
- View historical weather records directly on a web page
- Load weather records into Excel and export data for reports
- Worldwide historical weather database going back decades
- Free option for occasional users
- Low cost for both individual and higher-volume team & enterprise use
- Expert support available to help you understand the weather data
- Certified reports available that compare multiple sources for optimal accuracy and data traceability