

This article describes how to create a new Jupyter notebook that retrieves weather data from the Visual Crossing Weather API. The example uses Python as development language but you can choose any language that Jupyter supports including C++ and R.
JupyterLab is used to create the notebook. JupyterLab is a web-based interactive development environment for Jupyter notebooks, code, and data. The notebook allows us to combine our code with additional text and visualizations. This will make it easy to use the weather data in charts as well as combine it with additional information for data analysis. In this example, some very simple bar charts are created using Pandas plots.
Step one – Create a new notebook
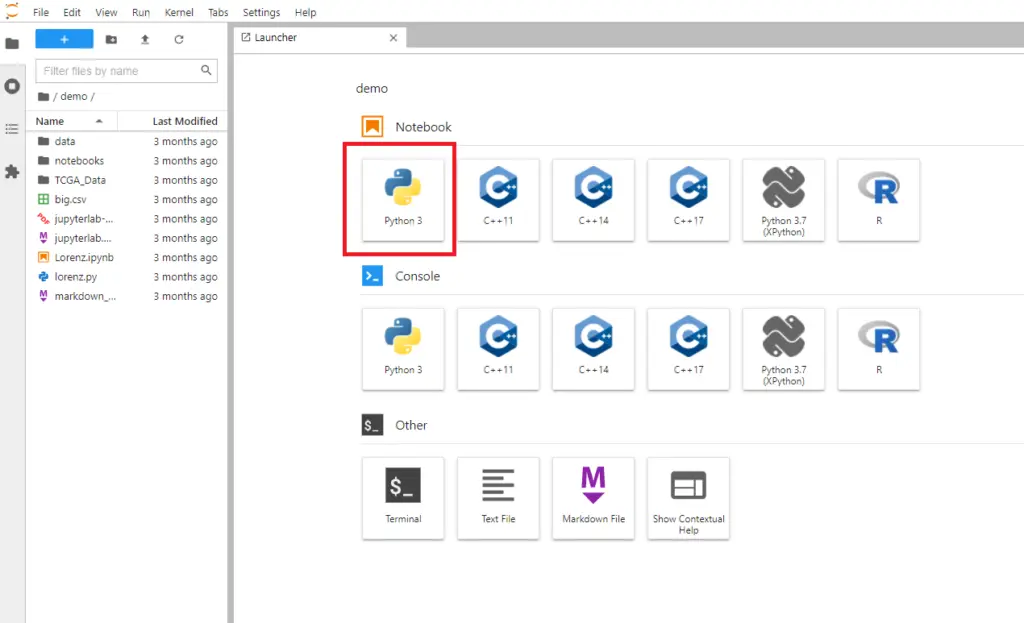
You can create a new notebook in your browser by navigating to https://jupyter.org/try and clicking on “Try JupyterLab”:

In our simple case, we will create a new Python 3 notebook:
Step two – create code to retrieve weather data
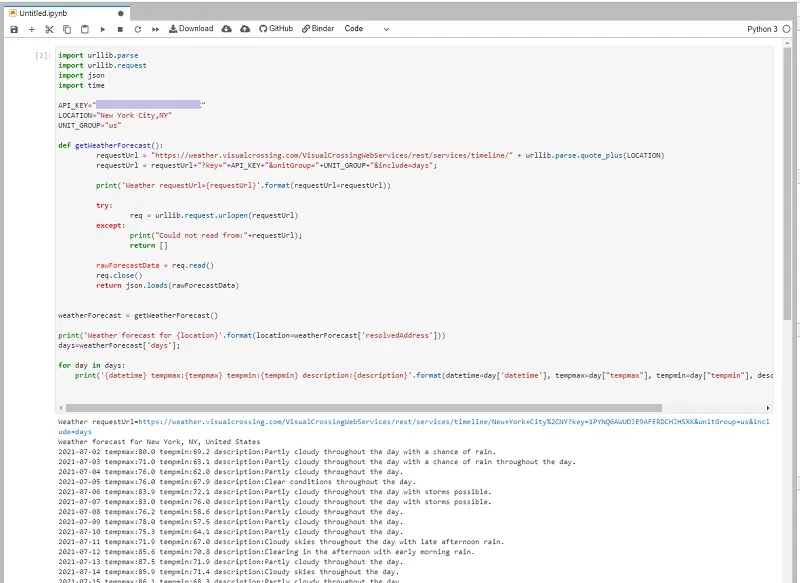
Now we have an empty notebook, we can use the following sample code to retrieve and display some weather data. Note that you need to replace ‘YOUR_API_KEY’ with your own weather API key. If you don’t have a key, you can sign up for one for free here.
import urllib.parse
import urllib.request
import json
import time
import matplotlib.pyplot as plt
import pandas as pd

API_KEY="YOUR_API_KEY"
LOCATION="New York City,NY"
UNIT_GROUP="us"

def getWeatherForecast():
         requestUrl = "https://weather.visualcrossing.com/VisualCrossingWebServices/rest/services/timeline/" + urllib.parse.quote_plus(LOCATION)
         requestUrl = requestUrl+"?key="+API_KEY+"&unitGroup="+UNIT_GROUP+"&include=days";

         print('Weather requestUrl={requestUrl}'.format(requestUrl=requestUrl))

         try:
                 req = urllib.request.urlopen(requestUrl)
         except:
                 print("Could not read from:"+requestUrl);
                 return []

         rawForecastData = req.read()
         req.close()
         return json.loads(rawForecastData)

weatherForecast = getWeatherForecast()

print('Weather forecast for {location}'.format(location=weatherForecast['resolvedAddress']))
days=weatherForecast['days'];

for day in days:
    print('{datetime} tempmax:{tempmax} tempmin:{tempmin} description:{description}'.format(datetime=day['datetime'], tempmax=day["tempmax"], tempmin=day["tempmin"], description=day["description"]))
We can then hit “Run the selected cells” toolbar button to execute our code and the weather forecast is printed out to the console.
Step three- create Pandas plots with the weather data
Now that we have successfully downloaded weather data into the Jupyter Notebook, we can start using the data for something useful. Let’s create some charts of the daily high and low temperatures,
To do this, we will use the Pandas data analysis library.
We can load the weather data directly into a Pandas dataframe:
dataframe = pd.DataFrame(days)We can then transform this into a plot using the DataFrame plot methods. For example we can create a bar chart with the daily minimum and maximum temperatures using the line:
dataframe.plot.bar(x='datetime', y=['tempmin', 'tempmax',], color={ "tempmin": "blue", "tempmax": "red"})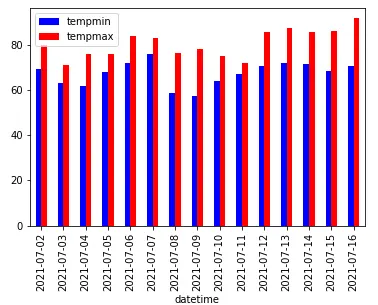
Using a side-by-side bar chart for temperature range is a little tricky to read. Let’s make this easier by displaying a single bar that shows the range from minimum to maximum temperatures for each day. To do this, we add a new derived value ‘ tempmaxdelta ‘ to the dataframe that is the difference between the minimum and maximum temperatures. We then stack the minimum temperature with the new ‘tempmaxdelta’ value. Finally we give the minimum a transparent color using the custom RGBA value so it doesn’t show.
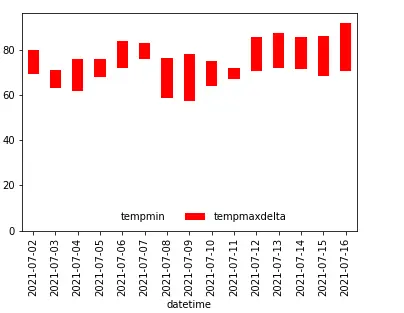
dataframe['tempmaxdelta'] = dataframe.apply(lambda row: row.tempmax-row.tempmin, axis = 1)
ax=dataframe.plot.bar(x='datetime', y=['tempmin', 'tempmaxdelta'], color={ "tempmin": '#00000000', "tempmaxdelta": '#ff0000'}, stacked=True)
ax.legend(frameon=False, loc='lower center', ncol=2)
Questions or need help?
If you have a question or need help, please post on our actively monitored forum for the fastest replies. You can also contact our Support Team.